Enhancing Daylight and Improving Energy Usage through the Utilization of Lightshelves in Deep Plan Office Buildings in Dubai تعزيز ضوء النهار وتحسين ا
|
|
|
- بنان بنو كلب
- منذ 6 سنوات سابقة
- المشاهدات:
النسخ

1 Enhancing Daylight and Improving Energy Usage through the Utilization of Lightshelves in Deep Plan Office Buildings in Dubai تعزيز ضوء النهار وتحسين استغالل الطاقة باستخدام األرفف الضوئية في مباني المكاتب عميقة المدى By: Thuraya Hael Al Waary Dissertation Submitted in partial fulfillment of MSc in Sustainable Design of the Built Environment The British University in Dubai Dissertation Supervisor Professor Bassam Abu-Hijleh July 2012 I
2 Abstract A city like Dubai that is ever growing with a constant need and demand for more energy, one can only think of solutions to mitigate this issue. Introducing daylight into office buildings can bring about major benefits to human health and comfort as well as reduce energy consumption levels. The use of daylighting is a key strategy for energy reduction as well as improving the quality of light in an interior environment. However, introducing daylight into deep plan office buildings remains a challenge when relying only on regular windows and skylights. Therefore, this study looks at the employment of lightshelves as an innovative strategy to penetrate daylighting into the office space. In order to calculate the effect of having lightshelves into a space, a modeling simulation was performed through IESVE. An important aspect about the office modules is that it included a dimming profile that was set to 300 lux. This profile worked through the placement of sensors within the space. Sensors simply measured light penetration, and then shifted the dependency on electrical lighting to daylighting. This process helped in the reduction of energy consumption levels vastly. The proposed lightshelves with light dimming profiles have achieved the most energy savings in the south orientation which resulted in 22.6%.However when assessing the study of different plan depths results for 5x5m show greatest reductions and light penetration due the small depth of the space. The 5x10m was considered the most ideal depth and reduction for the study achieving a maximum of 22.6%. The addition of the lightshelves has benefited the office modules energy efficiency which was confirmed through the placement of lightshelf heights. The 0.5m height from the roof revealed the highest reductions reaching 25.1% serving as a shading device and blocking internal heat gain from entering the space. The placement of openings in the lightshelves between cases of 1, 2 and 3 openings no significant change in energy consumption was observed. Therefore, this analysis is likely not sensitive enough for studying the number of openings on the lightshelf. However both exterior projections and interior depths of the lightshelves effected light penetration and energy reductions in the study. The energy benefit from the shading effect is more desirable with a longer projection in the exterior. As for the total energy, the 2m exterior projection showed 22.6% reductions. While the interior depth of the lightshelves determined that a climate like Dubai would always benefit from the most shading, the highest total energy reductions remained at the 7.5m and 5m at 22.6%. II
3 The combined analysis was then tailored for the optimum energy reduction levels. The total energy consumption revealed 24.5% which showed the highest and most ideal amongst the rest of the cases. From the study, an important aspect that came across was that earlier in the morning findings confirmed that the building was not under direct solar load from the glazing. A general conclusion that was derived is that each kw of reduction in light energy is likely to save around a kw in cooling energy. In conclusion, using lightshelves with a light dimming system confirmed energy reductions in office modules located in the city of Dubai, while allowing light deeper into the interior space. III
4 م 5 ملخص للتعامل مع مدينة دامئة التطور مثل مدينة ديب ويف ظل المنو املسمتر الحتياجات املدينة من الطاقة ال بد من التفكري يف حلول للتخفيف من حدة هذه املشلكة. ان من شأن ايصال ضوء الهنار الطبيعي اىل داخل مباين املاكتب أن حيقق فوائد مجة لصحة االنسان ولراحته فضال عن خفض مستوايت اسهتالك الطاقة. وال شك أن استخدام ضوء الهنار الطبيعي ميثل اسرتاتيجية رئيسية للحد من اسهتالك الطاقة ولتحسني نوعية االضاءة يف البيئات املغلقة. ومع ذكل فان ايصال االانرة الطبيعية اىل داخل املاكتب العميقة املدى ال يزال يشلك حتداي عند الاعامتد عىل نوافذ ومناور فقط يف املباين. تبحث هذه ادلراسة يف استخدام الرفف الضوئية اكسرتاتيجية مبتكرة النفاذ االضاءة الطبيعية اىل داخل أجواء املاكتب. ومن أجل احتساب تأثري استخدام الرفف الضوئية يف فضاء معني مت تنفيذ منوذج حمااكة ابعامتد برانمج.IESVE من املزيات الهامة اليت تمتتع هبا الوحدات املكتبية هو أهنا تتضمن وسيةل تعتمي مت ضبطها عىل مس توى 033 لوكس. تعمل هذه الوسيةل من خالل وضع أهجزة استشعار يف أجواء املاكتب وتقوم أهجزة الاستشعار هذه ببساطة بقياس مدى نفاذ الضوء ومن مث تقوم ابلتحويل من الاعامتد عىل االانرة الكهرابئية اىل الاعامتد عىل ضوء الهنار الطبيعي. لقد ساعدت هذه العملية يف احلد من مستوايت اسهتالك الطاقة بشلك كبري. حققت الرفف الضوئية املقرتحة ويه مزودة بوسائل تعتمي أعىل الوفورات يف الطاقة املسهتلكة عند امليل ابجتاه اجلنوب بلغت نسبهتا 6 و %22. عىل أية حال تبني دلى دراسة العامق اخملتلفة أن احلزي x5 أعطى أعىل ختفيضات ونفاذية للضوء وذكل بفضل قةل معق احلزي. وقد وجدت ادلراسة أن احلزي 03x5 م يمتتع ابلعمق المثل وحيقق التخفيض العىل بنسبة بلغت 6 و %22. ساعدت الرفف الضوئية يف حتسني كفاءة الطاقة يف وحدات املاكتب وهو ما مت تأكيده من خالل حتديد ارتفاعات الرفف الضوئية. وقد تبني أن الارتفاع اذلي يقل بنصف مرت عن ارتفاع السقف يعطي أعىل وفورات بنسبة 0 و %25 وهو ما يعمل كوسيةل تظليل وحيول دون ترسب احلرارة ادلاخلية املكتسبة اىل احلزي. هذا ومل يالحظ أي تغري ذي معىن IV
5 يف جحم اسهتالك الطاقة عند وضع فتحات يف الرفف الضوئية ومل يكن ةمة فرق بني وجود فتحة واحدة أو فتحتني أو ثالث فتحات. وعىل هذا فان هذا التحليل يشري اىل عدم أمهية عدد الفتحات يف الرفف الضوئية. عىل أية حال كشفت ادلراسة أنه اكن للك من الربوزات اخلارجية والعامق ادلاخلية تأثري عىل نفاذ الضوء وختفيض الطاقة املسهتلكة. ال شك أن الفائدة اليت حنصل علهيا من التظليل تكون أعظم لكام اكن الربوز اخلاريج أطول. أما فامي يتعلق مبجمل الطاقة املوفرة فان بروز ا خارجي ا بطول مرتين أعطى ختفيض ا بنسبة 6 و %22. يف الوقت اذلي يتبني فيه من العمق ادلاخيل للرفف الضوئية أن ظروف ا مناخي ة مثل مناخ ديب تستفيد أكرث ما تستفيد من معليات التظليل بقيت أعىل وفورات يف الطاقة املسهتلكة عند 5 و 7 م و 5 م وبنسبة 6 و %22. مت بعد ذكل هتيئة التحليل املشرتك لتحقيق مستوايت مثالية للتقليل من اسهتالك الطاقة. وقد كشف الاسهتالك االجاميل للطاقة ما نسبته 5 و %25 وهو ما اكن العىل والمثل من بني مجيع احلاالت الخرى. ومن اجلوانب الهامة اليت توصلت الهيا ادلراسة يه أن املبىن مل يكن يف الصباح الباكر حتت عبء الوجه الشميس املبارش. واكنت احدى النتاجئ العامة اليت توصلت الهيا ادلراسة يه أن ل كيلووا من الطاقة الضوئية جيري توفريه يوفر أيض ا كيلو وا واحدا من الطاقة الالزمة للتربيد. وختاما خنلص اىل القول ان استخدام الرفف الضوئية املزودة بوسائل تعتمي حتقق وفورات يف الطاقة املسهتلكة يف مباين املاكتب يف مدينة ديب ويه يف الوقت نفسه تسمح للضوء ابلنفاذ اىل مناطق أكرث معق ا يف املساحات ادلاخلية. V
6 ACKNOWLEDGEMENT I would like to express my sincere gratitude to my supervisor Dr. Bassam Abu-Hijleh for his support and guidance throughout my degree and research. Most importantly, I would like to sincerely thank my parents, and the members of my family especially Dr. Naela who has provided me with invaluable support throughout my whole journey. A thank you goes out to my brother Zaid Al Waary for providing me with the constant encouragement and moral support. I would also like to thank my dear friends and most of all Rami Zahran for his valuable input and support throughout my dissertation period. Lastly I would like to thank my colleagues and most importantly Emir Aykut Pekdemir for his constant direction and valuable input. VI
7 Table of Contents: Abstract... ii Acknowledgment... v Table of Contents... vi List of Figures... xi List of Tables... xiv Chapter 1 INTRODUCTION 1.1 Introduction Background Information Defining Daylight Daylighting in Architecture The Effects of Lighting on Productivity and Wellbeing Energy Consumption in Buildings Provisions for Daylighting in Green Building Rating Systems, Standards and Codes Research Outline Chapter 2 LITERATURE REVIEW 2.1 Introduction Literature that Discuss the UAE Benefits of Daylighting The use of Daylighting In Office Buildings Design for Daylighting The Problem with Deep Plan Office Introducing Innovative Daylighting Systems Light guiding Systems Lighting Transport Systems VII
8 2.8 Lightshelves Lightshelves in Buildings Design Strategy and Parameters Problem Statement Aims and Objectives Chapter 3 METHODOLOGY 3.1 Method Selection Methods that Assess Lighting Energy Consumption Advantages and Disadvantages of Different Methods Comparison Between Different Methods Method Selection Selection of Simulation Tool Process Integrated Environmental Solutions Validity and Reliability Defining Research Parameters Chapter 4 SIMULATION MODEL 4.1 Introduction Research Parameters Assigning Weather Data Building Usage Data Variables Area of Focus Orientation of the Building VIII
9 4.3.3 Space Chosen Module Materials and Finishes Data Opaque Construction Materials Lightshelf Materials Lightshelf Height Number of Lightshelf Openings Energy Conservation Measures Basis of Analysis Office Modules Chapter 5 RESULTS AND DISCUSSION 5.1 Introduction Study for Orientation Study of Plan Depth Study of Lightshelf Height Study of Lightshelf Openings Study of Lightshelf Exterior Projection Study of Lightshelf Interior Depth Optimal Configuration Analysis Summary and Discussion Chapter 6 CONCLUSION 6.1 Conclusions and Recommendations Recommendations for future work References IX
10 Appendices... Appendix A: Simulation Results A.1 Study of Orientation A.2 Study for Plan Depth A.3 Study for Lightshelf Height A.4 Study of Lightshelf Openings A.5 Study of Exterior Projection A.6 Study for Interior Depth X
11 List of Figures Page Figure 1.1 Passive Zone in Buildings 8 Figure 2.1 Two Types of Lightshelves 26 Figure 2.2 Figure 3.1 Two types of Lightshelves Daylight Factors (%) in the Example Rooms with Varying External Lightshelf Figure 3.2 Building Envelope and Daylighting Comparison 50 Figure 3.3 Daylighting Comparisons 50 Figure 3.4 Ecotect Daylight Analysis 53 Figure 3.5 IES Daylight Analysis 53 Figure 4.1 Occupancy and Lighting Schedule Sun-Thursday 61 Figure 4.2 Occupancy and Lighting Schedule Set for Friday and Saturday 61 Figure 4.3 3D Model 63 Figure 4.4 Plan (left) and Section (right) 10 meters 63 Figure 4.5 Dimming Graph 65 Figure 4.6 Sensors in the plan 66 Figure 4.7 East Orientation Plan and 3D 67 Figure 4.8 South Orientation Plan and 3D: 67 Figure 4.9 West Orientation Plan and 3D 67 Figure x5 Plan and 3D 68 Figure x15 m plan and 3D 68 Figure Openings Plan and 3D 69 Figure Openings Plan and 3D 69 Figure m Height Plan and 3D 69 Figure m Height of LS 70 Figure Exterior Projection 70 Figure meter exterior Projection 70 Figure Interior Depth 71 Figure Interior Depth 71 Figure 5.1 South Façade Peak Hour at Aug/12 75 Figure 5.2 South Façade Lightshelf Daylight Flux Analysis 76 Figure 5.3 East Façade Peak Hour Graph at Aug/12 77 XI
12 Figure 5.4 East Façade Daylight Flux Analysis 77 Figure 5.5 West Façade Peak Hour Graph at Aug/12 78 Figure 5.6 West Façade Daylight flux 79 Figure 5.7 5x5m Plan Depth Peak hour graph at Aug/12 82 Figure 5.8 5x5m Plan Depth Daylight Flux Levels 83 Figure 5.9 5x10m Plan Depth Peak Hour Graph at Aug/12 83 Figure x10m Plan Depth Daylight Flux Levels 84 Figure x15m Peak Hour Graph at Aug/12 84 Figure x15m Plan Depth Daylight Flux Levels 85 Figure m Height of Lightshelf Peak Hour Graph at Aug/12 88 Figure Height of LS Daylight Flux Levels 88 Figure m Height of Lightshelf Peak Hour graph at Aug/12 89 Figure m Height of LS Daylight Flux 90 Figure m Height of Lightshelf Peak Hour Graph at Aug/12 90 Figure m Height Daylight Flux Analysis 91 Figure Opening in the Lightshelf Peak Hour Graph at Aug/12 93 Figure Opening in Lightshelf Daylight Flux Analysis 94 Figure Openings Placed on the Lightshelf Peak Hour Graph at Aug/12 95 Figure Openings in the Lightshelf Daylight Flux Analysis 95 Figure Openings in the Lightshelf Peak Hour Graph at Aug/12 96 Figure Openings in the Lightshelf Daylight Flux levels Analysis 97 Figure m Exterior Projection of Lightshelf peak hour graph at Aug/12 99 Figure m Exterior Projection of Lightshelf Daylight flux analysis 100 Figure m Exterior Projection of Lightshelf Peak Hour Graph at Aug/ Figure m Exterior Projection of Lightshelf Daylight Flux Analysis 101 Figure m Exterior Projection of Lightshelf Peak Hour Graph at Aug/ Figure m Exterior Projection of Lightshelf Daylight Flux Analysis 102 Figure m Interior Depth of Lightshelf Peak Hour Graph at Aug/ Figure Interior Depth of Lightshelf Daylight Flux Analysis 105 Figure m Interior Depth of Lighshelf Peak Hour Graph at Aug/ Figure m Interior depth of Lightshelf Daylight Flux Analysis 106 Figure m Interior Depth of Lightshelf Peak Hour at Aug/ Figure m Interior Depth of Lightshelf Daylight Flux Analysis 107 XII
13 Figure 5.37 Combined study peak hour graph at Aug/ Figure 5.38 Combined Study Daylight Flux Analysis 111 Figure 5.39 Combined Analysis Graph. 112 Figure 5.40 Combined Analysis of Daylight Flux for All Cases 116 XIII
14 List of Tables Page Table 1.1 Horizontal Illuminances Recommended for Offices 8 Table 3.1 Comparison of Different Methods 46 Table 4.1 Design Weather Data (IES-VE database) 58 Table 4.2 Weather Model Data (IES-VE database) 58 Table 4.3 Internal Gains of Heat 59 Table 4.4 External Gains of Heat 60 Table 4.5 Base Cases 62 Table 4.6 Opaque Construction Materials 64 Table 4.7 Glazed Materials 64 Table 5.1 Orientation Parameters 63 Table 5.2 Baseline for Orientation 63 Table 5.3 Study for Orientation 73 Table 5.4 Plan Depth 79 Table 5.5 Baseline for Deep plan 80 Table 5.6 Study for Plan Depth 80 Table 5.7 Lightshelf Height 85 Table 5.8 Baseline for No Lightshelves 85 Table 5.9 Lightshelf Height 85 Table 5.10 Number of Openings 92 Table 5.11 Baseline of No Lightshelf 92 Table 5.12 Study of Lightshelf Openings 92 Table 5.13 Exterior Projection 97 Table 5.14 Baseline for No Lightshelves 98 Table 5.15 Study of Exterior Projection 98 Table 5.16 Study of Interior Depth 103 Table 5.17 Baseline for No Lightshelves 103 Table 5.18 Interior depth of Lightshelf 103 Table 5.19 Baseline 109 Table 5.20 Combined study 109 XIV
15 Table 5.21 Calculation of Average Reduction in Chillers Energy per each kw Savings in Lighting Energy. 111 XV
16 CHAPTER 1- INTRODUCTION 1
17 1.1 Introduction Current trends in architecture in the UAE, specifically Dubai, have been steered towards sustainability in the built environment. However, the massive energy demands owing to the excessive heat in the region set most office buildings up for serious shortcomings. The rising numbers of innovations and design applications could make it possible to reduce energy levels by harnessing one of the Gulf s biggest existing natural resources sunlight. As an outcome, vast amounts of electricity are consumed while there is plenty of daylight that could be used for illumination (Muhs, 2000). Nowadays, environmentally aware assessments of building design are acknowledging the importance of exploiting daylight. Taking part in a world that is concerned, the planned use of daylighting has become a vital approach to enhance energy efficiency as well as reducing lighting, heating and cooling loads. Even so, daylighting is not new; it existed in ancient eras and civilisations. Today, daylighting is used as a common design tool. However, recent attention has been redirected at daylighting due to the impact it can have on energy saving, classifying it under the sustainability umbrella. Therefore, introducing innovative and advanced lighting systems can significantly decrease energy consumption as well as enhance the quality of light in an indoor environment. In the UAE today, most buildings rely primarily on windows and skylights for daylight illumination. This is not sufficient to meet the needs of most deep plan office buildings. To address this problem, this paper will seek to explore the potential for increasing daylight in deep plan office buildings by utilizing innovative strategies that can penetrate daylight into the space. 1.2 Background Information The light provided by the sun is the source of life and energy on earth. The existence of nearly all life on Earth is fuelled by light from the sun. Daylight is considered to be more than a blessing in which the human eye seeks it, and there are numerous studies that prove health benefits to humans from its presence (Sullivan and Horwitz-Bennett, 2009). Daylight is known to be an essential source of light and it is highly desirable by many people. In various types of buildings daylighting can reduce electricity consumption as well as increase worker productivity. Consequently, commercial buildings and lighting design should take account for functional requirements as well as biological and psychological needs of its occupants. 2
18 To perform visual tasks, artificial lights can provide sufficient levels of illumination; however it cannot provide the occupant with the physiological and psychological benefits of natural light. Studies have been increasingly recognising issues that involve artificially lit buildings with health and productivity. Therefore, current sustainable design developments have stirred efforts towards maximizing the use of this natural light source, as well as providing healthy environments for people. Yeang (1999) expresses that existing designs of large buildings, which include office buildings are usually contrary to these principles. Although daylight is essential, several problems such as glare and high energy consumption levels are associated with the use of daylighting especially in hot climate areas. This simply means that daylighting is not the focal issue in most building designs. As lighting accounts for between a third and a half of the energy use in commercial buildings (Phillips, 2004) the reduction of energy use in buildings has been a major objective. Edmonds and Greenup (2002) proposed that the main objective of subtropical window design is thermal comfort in summer. This makes it clear that if daylight penetrates through the windows then light energy can be reduced. In addition, internal daylight levels in shaded sub-tropical buildings are well below those achieved in buildings taking place in moderate climates (Freewan, 2010). However, daylight can also increase the required cooling energy. This confirms why the energy used for lighting accounts for up to a third of electricity consumed for office buildings in many countries. Building a sustainable mechanism that maximizes the use of daylight faces a very big challenge. The biggest challenge rises from the fact that to be able to provide lighting in an indoor environment, natural daylight must be supplemented with an alternative source of light which is derived from supplied electricity. If the electrical supply is not regulated and well calculated it can result in a waste of precious energy, which of course is not sustainable in the long run for financial and environmental reasons. A form of control such as dimming sensors can potentially limit the excessive levels of daylight, which can provide an appropriate balance between electricity consumption and natural lighting. Coming up with effective strategies remains the challenge in today s sustainable drive. Leading design and construction professionals are working hand in hand with building owners to enforce new technologies with integrated design systems and solutions. (Sullivan and Horwitz-Bennett, 2009) 3
19 Daylighting systems do not only consist of windows and skylights, they also include responsive lighting control systems ( These control systems are capable of reducing lighting power when adequate ambient lighting is provided at different times of the day. When daylighting enters the space, it creates an interlink between the outer environment, and the sunrays penetrating into the indoor environment. A visually appealing space and reduced energy costs are obtained. Implementing daylighting strategies to a certain project s floor plan involves various parameters and considerations that must be observed in detail. Such considerations include avoiding the admittance of direct sunlight into the space. Direct sunlight in the space creates a substantial amount of glare, possibly affecting the occupant s visual comfort as well as the ability to work on technology. Daylighting often requires an integrated design approach to more adequately reach a successful implementation model. These approaches often require various strategies planned by the designers that further analyse design parameters, the setting, climate, building form and components into consideration. 1.3 Defining Daylight Philip (2010) expresses that daylighting can be understood as the controlled entry of natural light that would be able to reduce or eliminate the need for electric lighting. Mardaljevic et al. (2006) state that daylight illumination levels in a given space are usually dynamic, and are constantly varying in intensity. In addition, the distribution of light in an environment is an outcome of the two major sources of daylight: the sun and the sky. The sun and sky both act together in cooperation with the geometry and physical properties of the space, the exterior context, as well as the existing interior conditions. To understand concept of light, it is important to consider that daylight differs with season, the time of day, the latitude, and depending on weather conditions of the setting (Benggeli, 2010, p.273). During the winter season, usually there is less sunlight available than in summer. In addition, an overcast sky differs substantially from a day with clear skies, in which conditions may vary during several times a day. Direct sunlight may be required in cold regions around the world, and during colder seasons. In a colder region, the use of sunlight/daylight could be useful for components such as solar heating. 4
20 Daylighting is defined as the controlled admission of natural light direct sunlight and diffuse skylight into a building to reduce electric lighting and saving energy. (Ander, 2011) Daylighting systems features apertures such as windows and skylights, in which sun rays can penetrate through, thus allowing the sunlight into the space. The light coming from the sun is called sunlight, which is usually considered to be brighter than the ambient lighting. Moreover, the sun position is constantly varying as the day moves forward. Daylight however does not only consist of daylight apertures, it also includes daylight responsive lighting control systems ( These systems are able to reduce artificial lighting loads when sufficient daylight is present. Illuminance is one of the most commonly used terms when discussing daylighting. Illuminance is defined as the amount of light falling on a surface. Ankrum (1996), states that the illuminance level is the most common and often used specification of lighting. It is usually measured in Lux (lx) which is the international unit adopted, as well as using the term footcandle which is approximately 1 fc= lx. There are various organizations that may specify guidelines for specific illuminance levels for using computers for example. The issue that rises is that illuminance is not seen, except if it has been reflected from or passed through a physical surface or an imaginary plane. Luminance is another term that is rapidly used within the lighting and design sector. Luminance refers to the amount of light emitted from or passing through a surface. Regularly, measured in candelas per square meters (cd/m²). Luminance can be perceived in opposed to illuminance that is not seen by the eye. There are numerous ways to define the word glare. A simplified meaning would define it as the unwanted light, causing discomfort or disability. As well as the term might be subjective to what it refers to. A burglar may perceive a policeman s blinding flashlight as glare, whereas a policeman might consider it as a very strong light. (Ankrum, 1996) At the same time, human beings have different visual systems that depend on various factors. An example for a factor that plays in the visual system is age, in which lighting conditions may be ideal for a certain person and at the same time inappropriate for someone else with a different age. 5
21 Before looking at some of the various considerations, it is important to understand the huge impact daylighting has on architecture as well as productivity and wellbeing. 1.4 Daylighting in Architecture Daylighting in buildings can have major influences varying from aesthetic, health and comfort to economic ones. From the start of the earliest caves, daylight was the principal informer to the inhabitants to be able to differentiate between night and day. Philips, (2004) discusses that the history of architecture is synonymous with the history of the window and of daylighting from initial crude openings; letting in light and air, heat and cold, the window was the vehicle from the introduction of daylight. During the industrial revolution, factories, workshops, and office buildings first appeared (Baker et al, 1993). This is where the indoor environment needed adequate lighting for tasks to be performed. Before the invention of the electric light bulb, the buildings consisted of narrow plans and high ceilings allowing light to penetrate into the space. Other innovative concepts of daylighting were developed in the southern part of Germany where the early Baroque churches were constructed. These churches consisted of indirect lighting that reflected onto the ornate decorations of the church. Indirect use of daylighting is similarly used today, at Coventry Cathedral, or at the Bagsvaerd Church in Denmark. Through the development of different kinds of fluorescent lamps, building design changed. One of the main objectives of lighting in architecture is vision. Phillips (2004) confirmed this by stating that light enables us to perform, and without it the building would cease to function. Before electrical lights existed, most buildings simply responded to the daylight conditions of a setting in order to create suitable lighting levels for the indoor environment. Throughout the reflection of architecture in history, it was made clear that natural lighting was a commonly used medium of architectural expression. Natural light simply changed a building s character turning it into a form with dynamic elements. Similarly, different elements that allow the entrance of light into a building can be perceived as expressions of buildings. Another design element that should be considered is the window, since it connects an occupant from an indoor environment to the outer environment. This example creates a more interesting and dynamic exchange between different spaces and scenarios. This connection forms a visual interest that is encouraged from daylighting conditions all year round. 6
22 1.5 The Effects of Lighting on Productivity and Wellbeing: Heschong, (2002) highlights the rising interest in the influence of indoor environments on occupant health and productivity in which it has revived a great interest in the potential benefits of daylighting. Several reports confirm the association between lighting and the reductions in worker absenteeism, higher retail sales, and better student health (Heschong, 2002). Essentially, daylighting is a significant source of light that offers several purposes. Tragenza and Loe (1998) state that the purpose of lighting is to give information: which is to also allow the people in a given space to perceive the nature of the space they are in, what other people are doing and what they have to accomplish in a task. The indoor environment requires light so that the occupants have a comfortable visual environment and to enhance the performance of visual tasks. In most offices and workplaces, artificial lighting is pursued in order for the occupant to carry out their work comfortably without any disturbances. Boyce (2003) suggested a simplified way to help understand the visual environment; he confirms that lighting can influence task performance by varying the visibility of the task itself (the visual system). He adds that lighting can also influence the effect on occupant s mood, and add motivation to be able to perform a certain task (the perceptual system). This is in addition to the ability of lighting to increase occupant s alertness (the circadian system). Moreover, Boyce, (2003) accounts these three routes are essential factors that would assure visual comfort, in addition to maximising the productivity level. Fotios, (2011) provides an example of productivity in an office is when good visibility of tasks is provided, in which it stimulates the staff and then promotes the well-being of staff, without discomfort or demotivating perceptions such as gloom. Without the presence of natural lighting, people may have a tendency to lose track of timing, in addition to being unaware of weather conditions, which could further result in the feeling of discomfort (Binggeli, 2010). Fotios, (2011) also suggests that lighting designers should target aiding the visual performance as well as improving positive aspects of the visual environment, when that is reached it aids task performance. Current offices have specific requirements of illuminance levels which would ensure adequate and suitable visibility for its occupants. Table 1.1 shows the recommended lighting for offices in various countries based on international guidelines and standards. 7
23 Table 1.1 Horizontal illuminances recommended for offices (Mills and Borg, 1999) Table 1.1 presented required values for tasks in offices, which are mostly general tasks, reading, and drafting tasks. The higher lux needs are mostly required for higher performance tasks. The lower the lux level, the simpler the task required. When looking at visual performance, it is vital to consider that visual tasks are expected to be performed with accuracy, safety and at reasonable speed. These requirements point towards implying specific constraints on the illuminance levels as well as the visual field where the attention is dedicated most (Baker and Steemers, 2002). Often, the visual system differs with the occupant s age, as well as from a person to another. In the case of provoking the visual field with excessive eyestrain, such as from a glare, a feeling of discomfort and other negative physiological conditions may result. When assessing visual quality of the interior environment, it is important for the occupant s field of view to be both aesthetically pleasing, as well as providing certain degree of interest. Various research s contribute to the theory of visual comfort related to the quantitative and qualitative aspects of the natural daylight, in addition to confirming that it considerably contributes to the well-being of pupils and thus lead to better performances ( Abdelatia et al, 2010). Tsangrassoulis (2008) published the article 'daylighting benefits' in which he confirmed the idea of daylighting having a major influence on human comfort. He also added that daylighting can majorly contribute to enhancing lighting quality and occupant comfort. For instance adequate lighting levels and colour rendering could alter occupant health and comfort. In addition to expressing a point that lighting can be a mood motivator and can majorly affect productivity levels due to reduced stress and fatigue. 8
24 After gaining a general idea on the influence daylighting had on architecture, its effect on human health and wellbeing, it is important to understand energy consumption in its current form and how buildings have contributed majorly in effecting the environment. 1.6 Energy Consumption in Buildings: Buildings consume almost 40% of the world s energy, 16% of the world s fresh water, and 25% of the forest timber, while they are also responsible for almost 70% of sulphur oxides and 50% of the CO2 emissions (Ghiaus and Inard, 2004). Tsangrassoulis, (2008) expresses that after the 1970 s energy crisis; attention to daylighting has grown majorly with rising energy prices. Later on, with the rising concern over global warming in our world, the most significant way to reduce electricity consumption levels is to efficiently decrease electrical loads. Energy consumption has witnessed a rapid growth globally, in which various concerns were raised due to the exhaustion of energy resources as well as the heavy impacts on the environment. Energy consumption is the main source of greenhouse gas emissions, which results in climate change (Hong, 2011). These impacts have been the major cause of the ozone layer depletion, in addition to contributing to global warming, and the dramatically unstable climate change. Energy consumption from residential and commercial sectors are the main contributors other than the industrial sector and transportation. Increase in the human population has resulted in the vast demands for building services and comfort levels, since most individuals spend most of their time indoors. The world witnesses a global building boom of extraordinary scale, resulting in several harmful consequences. Buildings are known to be the biggest energy consumers in the world, as well as being responsible for one-quarter to one-third of all energy use and a similar amount of greenhouse gas emissions (Hong, 2011). The industry has witnessed a rapid growth in the energy loads for services in various sectors due to energy demands. The automobile industry for example made several efforts in meeting strict fuel efficiency standards compared to the building industry. Unlike cars, buildings are constructed and designed to last for decades. Surprisingly, the least efforts have been addressed to find solutions for the huge amounts of energy being consumed. Lombard et al (2008), states that energy consumption in buildings accounts for 20-40% of the total final energy consumption in the service sector. The service sector mainly includes all of the commercial and public buildings, in which energy consumption and 9
25 service rates vary by type of building and usage required. HVAC, domestic hot water, lighting, refrigeration, are parts of the energy consumption usage required for schools, restaurants and hotels. Within the commercial sector, an office building accounts as one of the biggest consumers in terms of energy and Co2 emissions. The future therefore appears to lie in the targeting efforts and developments towards finding alternative solutions that would reduce the consumption level. After addressing information on the current building consumption levels, the next section offers a wide variety of current and previous provisions that address green buildings and initiatives toward sustainable direction. 1.7 Provisions for Daylighting in Green Building Rating Systems, Standards and Codes Numerous amounts of existing standards and guidelines call for the use of daylighting as a strategy to reduce energy consumption as well as improve light intensity in buildings. One of the main examples put to use in our modern day is the UAE s Green building guideline ( This regulation encourages efforts to move towards the provision of natural daylight for all new buildings, other than industrial buildings, provision for adequate natural daylight must be made in order to reduce their reliance on electrical lighting and to improve conditions for the building occupants and provide lighting openings in accordance with Dubai municipality building regulation and specification. (DEWA Green building, 2012) Other examples of international principal guidelines are the U.S. Green Building Council (USGBC), as well the important green rating system that is known as: Leadership in Energy and Environmental Design (LEED). Other provisions include The American Society of Heating, Refrigeration and Air-conditioning Engineers (ASHRAE) standards and guidelines that lead an energy efficient approach (ASHRAE 90.1 and 189.1). Sustainable drives most of the design and construction industries towards sustainability and energy efficient solutions in addition to highlighting daylight performance. This drive is carried out from useful guidance at the early stages of design, compliance with construction codes, to post-occupancy verification. (Mardaljevic, 2011) The performance of the daylighting in a certain space is a concern to various stakeholders taking part in the building. The stakeholders influenced with the issue of daylighting would be the following: 10
26 - Building occupants: those who work or perform tasks in the building, in preference to a specific amount of daylight levels, even if it was a minimized amount. - Those who are concerned with occupant s wellbeing, as well as performance benefits of daylighting in a building. These people are usually in charge of paying the salaries of building occupants. - The stakeholders that pay for the building costs, in which they would favour daylight exploitation, as well as electricity consumption level. - People who are involved in designing or manufacturing devices or technology that can control daylight, and make use of it in an efficient way. Examples of this are light pipes, lightshelves, types of glazing, and other shading devices etc. - Performance experts that pursue better solutions and improvements to existing ones. An example of these types of professionals is architectural teams that work towards design solutions for better efficiency performance levels. Ideally each of these stakeholders has a specific way of application, level of detail and precision, as well as format that would constitute daylight. 1.8 Research Outline The dissertation is divided into six chapters as follows: The first chapter: During the first chapter of this paper, an introduction to the study is presented as well as the research aims, defining daylight as well as its effect on architecture, productivity and wellbeing. The second chapter: The literature review is the following chapter which consists of information that that provides the reader with a full-on understanding of the topic as well as major aspects. This chapter looks into various types of papers that represent similar approaches opposed to the one being studied. Comparing and contrasting different research papers help compare results and approaches as well as adjust diverse parameters. Factors that affect energy consumption in offices are well presented and backed up with international standards to provide a baseline of understanding. 11
27 The third chapter: Research methods are discussed in this chapter in-depth and analysed and then compared to different methods that look into assessing energy and enhancing daylight performance in various office plans. Looking at various research parameters in comparison to current research study, will determine the best method to carry out for the research paper. The fourth chapter: The fourth chapter, the method is progressed and the analysis process is acquired. This chapter also includes all of the configurations and inputs used in the research, as well as the base cases and scenarios implemented. The fifth chapter: In this chapter, the results are obtained and presented, as well as discussed and compared to each other. The main aim of this chapter is to understand the differences and the impacts of the different configurations chosen. An optimal case is selected and discussed. The sixth chapter: The final chapter consists of the final conclusions obtained from the whole study. An optimal case is suggested, as well as further recommendations and amendments that could be of use for taking the study further. 12
28 CHAPTER 2 LITERATURE REVIEW 13
29 2.1 Introduction: Many architects discussed the effect of light in architecture; amongst them is the prominent figure in the early modern architecture "Le Corbusier, (1989). Interestingly enough, most of his projects present physical proof of the history of struggle for light. Further, Le Corbusier (1989) quotes that Architecture is the masterly, correct and magnificent play of volumes brought together in light... With the major significance daylighting has on human health, comfort, and performance, in many cases electric lighting supplanted daylight in buildings. (Kroelinger, 2002) Most of the time when artificial lighting is pursued it can be a major contributor to high consumption of energy. Therefore, when assessing indoor environments especially offices, it is crucial to consider the recent advancements that would help reduce energy loads, without affecting occupant performance levels, health and comfort. Providing advanced techniques that could enhance building performance as well as maximising the use of daylighting is vital. When daylight penetrates deeper into the space, it illuminates the indoor environment, making it a pleasant working environment. The literature in this chapter presents a variety of results in relation to buildings and innovative advanced lighting techniques. These advanced lighting techniques can provide energy saving through daylighting. Numerous amounts of research papers that discuss the importance of daylight presented in office buildings are discussed. These research papers help provide supplementary knowledge of the subject, as well increase research awareness and help develop research parameters and objectives. Several papers will be examined and analysed to attain a deeper understanding of lighting in terms of energy consumption, and lighting performance without affecting occupants. These research papers have been devoted to finding solutions that can mitigate the issue of energy consumptions in deep plan office buildings. A literature search was carried out using specific terms to obtain the correct information to pursue the study. The terms consisted of: energy consumption advanced lighting integration, shading devices, effective daylighting, lighting, lighting in office buildings, and evaluation of lighting in offices. In order to gain a deeper understanding of energy consumption, one should identify the basic building operations that are demanded. In general, most buildings are obliged to follow requirements that are set to achieve comfort and a suitable environmental condition for its occupants. 14
30 These requirements exist mainly in every functional building taking place in this day of time; examples of such requirements are HVAC systems, lighting, and appliances. However, looking into literature that discusses the UAE as a country is important to help achieve a better understanding of the industry as well as its demands from its shortcomings. 2.2 Literature that Discuss the UAE: Understanding the Unite Arab Emirates climate is key to understanding the design requirements of its infrastructure. However the climate is not the only factor to be considered in this study. The economy and the fuel propelling its growth also play a large role in determining the environmental impact on the nation. The UAE economy is largely based off the energy sector which has given the country vast wealth to further incorporate into projects. Kazim, (2007) research paper details how the discovery of oil in the Emirates in the 1960s has led to quick development and growth in the Gulf Cooperation Council member state. It has seen a 4.9% growth over the past 20 years and according to 2011 estimates from the CIA World Fact book, the UAE s GDP per capita stands at $48,500. However the UAE has early on realized that oil will one day run out and that an economy largely based on just one sector is not a viable strategy. As stated by Kazim (2007), the UAE began to ensure the sustainability of the country s economic growth by diversifying into other sectors such as construction, real estate and tourism amongst several others. Kazim adds that the diversification has helped leverage the impact of a decrease in the global price of oil in the late 1980s and has continued to help continue its economic growth. As the UAE became more open to foreign direct investments and large business deals, the construction industry matured hand in hand. The major increase in projects and in the development of design and buildings made the construction industry one of the prime demanding sectors. The construction industry involves a variety of parties contributing to human development and the overall quality of life with in the UAE. This is done through the terms of what is considered to be life s rudiments: shelter, water supply and hygiene, roads and railway networks etc. Kazim (2002) states that increased urbanization demands, as well as expanding industries and population growth have increased the levels of hazardous air pollutants such as carbon monoxide, nitrogen oxides, sulphur dioxide, hydrogen sulphide, ozone, hydrocarbons, chlorofluorocarbons, lead and other particulate matters. 15
31 High economic growth and urbanization took a giant step in the UAE since its date of independence in 1971 (Kazim, 2007). Kazim stated that there are three major parameters that drastically affect the UAE s energy consumption namely population growth, high urbanization and economic growth. His research assessed the UAE s primary energy consumption as well as its environmental impact on the country over the past two decades. As a result of the quick and steady economic boom in the Emirates a few challenges have become quite prominent in the construction industry. A key study carried out by Al Marashi and Bhinder (2008) discusses the urban challenges that face the city of Dubai since the construction boom. The paper further illustrates social, economic, and environmental implications related to the city of Dubai. Al Marashi and Bhinder (2008) state that the country is still young and evolving, hence the legal infrastructure is not completely in place This statement confirms that new measurements should be implemented and enforced in order to provide a much more environmentally friendly and concerned community. A further challenge outlined by Gill (2008) is the alleviation of the tough desert environment through the use of indoor spaces. Due to the limited use of the outdoors in the Middle East, a large focus is placed on the indoors. This creates a challenge in creating a suitable and sustainable living environment behind walls and windows. Through the rise of issues and concerns, the UAE recently started taking a role along the lines of pursuing sustainable development. A remarkable boom took place in the last two decades that was known to be heavily dependent on expats who came from different nationalities, and backgrounds. It is common to find stakeholders within the same project coming from different cultures to work within the UAE, which amongst other concerns affecting the performance and demands for various types of building. Moreover, the UAE is one of the biggest carbon emitters on a per capita basis due to the heavy dependence on natural gas and growing demands for air conditioning and desalination. According to Mitchell and Hulme (2000) the UAE consumes 9.40 tons of carbon emissions per capita. This is in contrast to countries like the UK which only consume 2.41 (tons/capita). Al-Sallal (2010) research paper confirms that buildings in the UAE are not considered to achieve proper shading or to improve occupant visual quality; hence his case study on school buildings was a great example to add on to this issue. The paper discussed and tested 16
32 educational spaces in which occupants had experienced direct sunlight, as a result of inappropriate solar orientation. Another addressed issue was that in deep educational spaces there were different cases that students' eyes were affected due to areas being directly lit, and other cases not fully illuminated spaces. Baker and Steemers (1993) also suggest that such lighting issues affect occupants and may initiate serious problems of high brightness contrast and acute glare that affect visual comfort and in some cases causing health problems. A paper aimed at sustainable development in the UAE by Salama and Hana (2010), explores the level of awareness of sustainability and construction. The paper recognised the important challenges that were facing the concept of sustainability. A survey was distributed to a random selection of 120 professionals taking part in the construction industry. Results of the study indicated that the construction industry in the UAE witnesses a growing awareness of sustainability, which is leading to a notable development in the green construction culture (Salama and Hana, 2010). Despite of the growing interest in the green notion, other suggestions such as legislations should be put in place to further improve the implementation of green buildings and the construction industry. A way of using the sun s light in a suitable manner, is looking at building envelopes, and orientation. Constructing a building in a way whereas daylight is accessible but not too direct in which it can disturb the occupants inside the interior space. Hammad and Abu-Hijleh (2010) conducted a study on the energy savings potential of using dynamic external louvers in an office building in the city of Abu Dhabi, UAE. The study was performed through a simulation software IES-VE in order to predict energy consumption by deploying external louvers at different orientations of the building s facade. The results of the study show that combined dynamic louvers with lighting dimming approach attained maximum reduction in energy consumption loads when compared to other scenarios tested. Additionally the implementation of using only light dimming methodology for the lighting, even without external louvers, is always advantageous (Hammad and Abu-Hijleh, 2010). While there is a great deal of attention paid to the importance of the idea of sustainability on contemporary architecture, Abdelatia, et al (2010) expresses his concerns associated with the creation of sustainable architecture in which most of the time they are incorrectly articulated and pointing towards low energy building" concepts, although they extend beyond energy related issues. While the emphasis is on the various environmental targets, it is important to 17
33 take into consideration lighting, and the several factors it can provide to the indoor environment such as the effects on productivity, as well as human health and comfort which in total affects the human's psychophysical state. Before initial steps are taken, there is a need to comprehend how the potential benefits that could be obtained from daylighting, and understand the major challenges that face the construction and design industry. 2.3 Benefits of daylighting Various benefits can be achieved from daylighting, yet it can also have a major significance on energy consumption levels. Relating back to Boyce (2003) paper on the current redundant electricity demands resulting from artificial lighting loads, concerns on alternative sustainable options that would reduce energy consumption demands. Boyce (2003) suggests two prospects for reducing lighting energy consumption are: 1) Greater use of daylight and 2) The development of more energy-efficient lighting technology. The next section will look into the first suggestion: The greater use of daylight. Almost all of the design projects start with a wide investigation of existing conditions. Existing conditions play a significant role on the project itself in terms of building performance. The location of the space chosen, the climate of the setting, and orientation of the building should be considered carefully, in which these factors influence light, view, and energy demands. Most of the interior spaces require a certain amount of light. This could serve for safety reasons, visual comfort, and to be able to perform tasks. Daylighting is recognized to have substantial benefits on both the environment, and the wellbeing of people. These benefits include enormous amounts of energy cost savings, as well as enhancing human visual comfort in the indoor environment. In addition, it is being described as the best source of light for good colour rendering and its quality is the one light source that most closely matches human visual response. (Li and Tsang, 2007) When daylighting enters the space, not only does it provide a pleasant atmosphere, as it also maintains a connection between the indoor environment and the outside world. People desire good natural lighting in their working environments in which they anticipate suitable daylighting in the environment they work or stay in (Roche et al, 2000). Finding a balance 18
34 between daylight provisions and reduction in energy consumption or demand through appropriate control of solar gains is the main question that has been addressed in previous studies (Lee and Selkowitz, 1995). Research has indicated that daylighting can drastically change energy consumption in many types of buildings and in all forms. This is because when daylight is adequate, artificial lighting is no longer required, making it easier and efficient for building landlords in terms of energy consumption. With more research data and information currently addressing the subject of daylighting, more architectural designers and construction practises have been recently integrating daylighting concepts into their buildings, furthermore to enhance building performance and head towards better energy efficient solutions. After looking at daylighting as an important source of light, it vital to recognize daylighting as factor that is considered to be one of the major environmentally responsible strategies that is attained a lot of focus and interest in the design industry. The issue that rises is that professionals have not yet assessed the advantages and disadvantages of daylighting before implementing it in the design stages. Advantages of daylighting: - The overall outcome of the presence of daylighting is the ability to reduce the amount of artificial lighting hence reducing energy consumption. In contrast to artificial lighting, natural lighting can produce lower rates of heat per lux. - Studies have proved the impact of daylighting on human health and wellbeing, in which it can also have an enormous impact on productivity and satisfaction of building occupants. It has also been established that daylighting has a major impact on mood swings and productivity and lower absenteeism levels. Disadvantages: Although daylighting is proved to have numerous amounts benefits if not executed properly it may have a negative influence on the space. - One important issue to consider is that direct sunlight can produce glare. Glare can be very unpleasant, making the occupants uncomfortable with the direct light, resulting in a lower 19
35 performance level. Controlling glare is an important aspect of daylighting system, which plays a major part in enhancing the lighting performance in the space. - Daylight can be a concern at times, if it generates a large load of heat into the space. This is because the sunrays are a very powerful source of heat, which can penetrate into the space and produce great amounts of heat. Controlling heat gain is essential in buildings to reduce cooling loads, which relying on HVAC systems to cool the indoor environment. This reduction of HVAC system will result in overall energy consumption savings. After outlining the most imperative aspects in relation to the study, the final and main benchmarks for judging lighting design would be the human eye. This means that no matter how well the lighting design conforms and adapts to a certain quantitative criteria, if the occupant in a specific environment is simply uncomfortable, the design has failed. Too much light can be uncomforting and harmful, but using it a source of illumination is considered efficient. 2.4 The use of Daylighting In Office Buildings All through history, daylight has been the prime source of lighting in buildings, supplemented originally with the burning of fuels and more recently with electrical energy. (Kroelinger, 2002) During the 19 th century before electric lighting was substituted, it was important to consider daylight strategies. Approaching the mid-20 th century, electric lighting successfully replaced daylighting in buildings in various occasions. (Kroelinger, 2002) Luckily, during the end of 20 th century the industry recognised the significance of daylight presence in buildings. Daylight has the ability to create a pleasant and a welcoming atmosphere, and as confirmed in various studies on schools and retail sales environments, it can as well impact human performance (Heshong Mahone Group, 1999a & b). Daylight can not only provide a bright atmosphere, but it can also provide an enjoyable interaction between the indoor environment and the outer view that the window offers. When lighting design is performed in an appropriate manner, energy savings aims can be achieved, especially when daylight levels are capable of illuminating the space. Bill Lam (2010), a lighting designer, presents John Hancock Tower in Boston as an example of a failure in architecture. The building was constructed mainly to avoid light with its building orientation facing east and west, in which the glazing prolongs from the floor to 20
36 about one foot directly above the ceiling. In avoidance of glare issues, interior blinds were put to use, leaving the artificial lights turned on the whole time. Basic daylighting approaches can consist of making windows and skylights available to penetrate into the space presented in many buildings in the northern Europe, but correct use of daylighting is defined as passive solar design. Daylighting involves the conscious design of building forms for optimum illumination and thermal performance. (Binggeli, 2010, p275) Controlled use of lighting is a challenge when pursuing daylighting design in demanding types of buildings such as hospitals, offices, libraries and laboratories. Daylighting can be designed to illuminate the space through side openings such as windows and top openings such as skylights or a combination of the two. The chosen strategy is mainly dependant on the type of building, aspect ratio and massing, climatic conditions, and site obstructions. Throughout time, introducing daylighting into buildings was known as side lighting (Kroelinger, 2002). It also provided connection to the outer area, and allowing room for ventilation in appropriate times of the year. Therefore daylighting should be included in offices to serve both purposes of reducing energy loads, and at the same time keep an ongoing connection with the outer surroundings. Daylight openings and controls vary in terms of building orientation. Moreover, desired distribution of light will differs with the location of the openings allocated, as well as taking into consideration wall system restrictions. Unver et al (2003) compared and contrasted between three different offices, mainly with an attempt to evaluate the difference in their daylight illuminance levels. The study had varied office dimensions, as well as glass types, and envelope transparency ratios. Results indicated that climatic conditions, façade orientation, as well as obstruction objects are the main parameters that were more influential factors. On the other hand, Hayman et al, (2000) suggests that when looking into conventional buildings, the use of advanced daylighting technologies integrated with effective lighting controls, and efficient lighting options, up to 75%-80% of electric consumption savings can be achieved. Daylight controls can also be called daylight compensation systems. Daylighting compensation works with an automatic dimming process, which results in a massive amounts energy savings during the day. Since most commercial offices operate from 9AM to 5PM, or 8AM to 6PM and sunlight is present during most or even most of the working hours. This system is able to reduce the need for artificial lighting when daylight is available to perform 21
37 tasks without reducing performance levels. Daylight compensation dimming can reduce energy use in perimeter areas by up to 60 percent. (Binggeli, 2010) Areas closer to the window will usually be illuminated, as for farther areas from the window will be darker. The approach places the sensors deeper into the space to detect daylight penetration. When daylight penetrates into the space, the sensor will detect it and start to dim artificial lighting. The results will be massive reduction in energy loads, as well as adequate lighting quality illuminating the space. Torcellini et al, (2007) address a paper on Solar Technologies & the Building Envelope, where it stated that Lighting is the largest single end use in commercial buildings, at 24% of the total primary energy used (EIA, 2010). Bodart and Herde (2001) propose that one of the major issues affecting and damaging the environment is the increase in CO2 emission. In addition, they suggest that the best solution for the reduction of the environmental pollution impact coming from the fossil energy combustion is by reducing our energy consumption. Over the years, countless numbers of research papers have looked into reducing energy consumption in buildings. Therefore new prospects have opened up for potential lighting energy savings especially in office buildings. The potential for daylighting savings is significant in relation to the energy consumed. Similarly, Torcellini, et al, (2006) presented a paper during the 1999 Commercial Buildings Energy Consumption Survey that expressed that nearly 80% of the total floor area in commercial buildings has a roof or is within 15 ft. (4.6 m) of an exterior wall, in which means that there is good potential to be at least partially day lit. When looking into exploiting daylighting further in the buildings Goulding et al. (1994) states that there are costs that may rise when doing so. Consequently there is a need for understanding the motives behind implementing daylight into buildings. The quality of natural light is one of the reasons why daylighting in buildings is important. Hansen, (2006) suggests the first and most important reason is that it is necessary to know that the human eye responds to natural light stimulus, which is known to be lacking artificial lighting. The naturally lit environment simply offers a better lit space, rather than one with electrical lights. Studies have proven the psychological and physiological advantages of daylighting on occupant performance levels, which are not comparable with electrical lighting. A main reason remains to be the energy consumption level that can be obtained on peak hours of the working day; daylighting seems to achieve high efficiency rates. A bigger result would be the 22
38 overall reduced impact on gas emissions since the dependence on non-renewable energy sources is no longer needed at certain hours of the day. After gaining a deeper understanding of daylighting, and the presence of daylighting in offices it is important to consider daylight performance and design. It is important to consider that daylighting must be integrated into the building serving both the needs of a suitable atmosphere, as well as reducing energy loads from the need to use artificial lighting. The next section will look into design for daylight which will set apart design success from failures. 2.5 Design for Daylighting There are various considerations that must be analysed when looking design for daylighting in offices. One important consideration is the working hours, and the time spent inside the indoor environment. Taking the city of Dubai as a base case for the study, in which the total hours are on average 8 to 9 hours per day. These hours spent inside the office are very much important since the occupant is exposed to artificial lighting most of the time. For an office space to be illuminated with light, the office is influenced by the orientation of the building, the sun s direction throughout the day, as well as the apertures dedicated in the space. Useful Daylight Illuminance (UDI) is a concept of daylight autonomy carried out by Mardaljevic and Nabil (2005). It is a type of metric system that is sets out lux levels ranges that are considered useful for occupant s perception. There are three ranges, Lux, Lux, and over 2000 Lux. These ranges are important because they simply put the useful illuminance levels into perspective. They show which levels are more suitable for the human from all aspects. The major challenge rises when looking at office buildings is harnessing huge amount of energy found in sunlight. Philip, (2010) expresses that on a clear day, the sun provides 8,000 to 10,000 foot-candles (fc) of light which is a major amount of sunlight transmitted. This similarly means that even when sunlight penetrates through glass into the indoor environment; it can also deliver around 5,000 fc on a clear day and 1,000 fc on a cloudy day. This is to mention that for example a person working in an office building would require 35fc for reading (Philip, 2010). Daylight approaches are usually determined by studying in-depth the presence and availability of natural light, which is determined by the building orientation, furthermore the environmental conditions that immediately have significance on the building 23
39 (Philip, 2010). For instance: the existence of different obstructions. Most of the time climate can have a major influence on daylighting; therefore, identifying climatic conditions is crucial. When these factors have been determined, parameters and method for the study is easily achieved. Konis (2011) stated as there is a growing interest towards the importance of daylighting in commercial buildings, there is less agreement for how electric lighting energy consumption, daylight sufficiency, visual comfort, and view performance objectives should be defined, measured, relatively valued, and how results should be interpreted to assess success from failure. Often, Effective daylighting is defined in a very diverse way depending on who views it from the design industry. This means that the mechanical engineer can simply perceive it in terms of electrical energy reduction (Deru et al, 2005) while the architect would look into various aesthetical attributes of the penetration of daylight deeper into the space. From a client s perspective, it could be a matter of compliance with certain requirements with in the daylighting criteria. However, the occupant may assess the daylighting performance in the indoor environment according to visual comfort, the least amount of glare, interaction with the outer space. In the design industry, each stakeholder is responsible for a certain perception. If not assessed correctly, in most cases it can lead to misleading conclusions. Therefore it is important to consider the wide range of factors that affect assessing daylight performance. Ideally, a metric could be both predicted through different approaches such as simulation as well as determined through measurements in the field so that predictions could be verified. (Mardaljevic, 2011) As mentioned earlier about daylighting, to assess general performance requirements of the buildings there are major variables to examine. These variables look further into climate, location, orientation, building type, as well as occupant requirements. The single greatest failure in daylighting designs is the lack of systems perspective that accounts for, and provides an integrated solution for the set of performance issues. (Selkowitz and Lee, 1995) In order to acquire the long lasting benefits of daylighting, the electric lighting must be controlled in response to the available daylighting, for example by having an integrated system, or a dimming profile. Sullivan, et al (2009) expresses his agreement on the same approach of controlled and incorporated daylighting and electrical systems adequately. Beyond looking at building standards and guidelines, any successful building that incorporates daylighting and electrical lighting systems should contain a carefully designed, 24
40 integrated, and calibrated control system (Sullivan, et al, 2009). This means that most of the projects should be assessed sensibly in terms of serving building performance, taking into consideration all of the aspects that can play as effective components to the building. Tanteri an educator with the International Association of Lighting Designers ( provides a preeminent approach which is to initially design buildings for daylighting, and then the second step is to address electric lighting. This means that when designing buildings, the maximisation of daylight in the space is taken as a first step, with an aim of minimising the need for electric lighting, when daylight is present. He also adds that space programming, zoning, control intelligence, as well as interoperability all act as factors, but emphasizes most on daylight first. 2.6 The problem with Deep Plan Offices: The advantages of natural light in office buildings are endless, yet they are non-existent. This is because of cost-effective reasons and spatial necessities of the workplace. Hansen et al (2003) state that floor plan designs of over 10 meters in depth most likely to result in dark cores, since side daylight passively reaches only up to 4 meters distance from the window. Therefore deep plan offices depend majorly on electricity. This results in large energy consumption demands for lighting. The Property Services Agency and Department of the Environment, (1976) defined deep plan buildings as buildings with an obstructed open plan of more than 17 meters. Baker and Steemers, (2000) assessed energy efficiency in buildings as the passive zone that can be illuminated with daylighting and naturally ventilated, as well as depth of the room should be twice the ceiling height. Furthermore, a deep plan office is one with a plan that s depth that surpasses the passive zone area. When this happens, the passive zone exceeded becomes none passive, in which it needs to be illuminated using electrical lighting. The research looks at alternative deep plan measures of the office buildings in an attempt to penetrate lighting further into the space. The deeper the plan is, the more the challenge it is. Therefore choosing the right device for daylighting is a major concern. Figure 2.1 demonstrates the passive zones in buildings. 25
41 Figure 2.1: Passive zone in buildings (Baker and Steemers, 2000) Hansen (2006) proposes that there are two leading motives behind the recent popularity in deep plan commercial buildings nowadays. This is due to financial benefit that route back to the plan having full site coverage. The second reason relates to companies that usually prefer their office usage area to take place in one level in order for all the facilities to be in one place. In these types of plans during most of the occupancy time, artificial/electrical lighting has replaced the use of daylighting in some cases. There are various office buildings are built with maximum site coverage, that then cause deep plan buildings to have little perimeter zone to obtain daylighting. (Hansen, 2006) On the other hand, other cases are due to the closeness of adjacent buildings that can cause shadow effects, as well as minimising the chances of lighting from reaching building facades. There are more reasons for relying on artificial lighting in deep plan spaces. The main reason is the varied illuminance levels between different areas of the space; some brighter others consisting of darker areas. Another reason is the large openings/windows that are built, that allow high admittance of light causing glare. When glare is present, it is necessary to place blinds that would obstruct daylight from entering into the space. Other reasons route back to the placement of enclosed offices closer to the perimeter of the building that eventually obstruct light from entering into the indoor environment. 26
42 Various considerations must be taken into account such as building form, orientation, location in which plays a major factor in influencing light admittance into the space. Nowadays, many progresses are shifting towards advancing daylight technology that can be efficient while not reducing comfort levels of building occupants. One of the advanced daylighting concepts serves both as a shading device, as well as a device that can reflect and redirect sunlight into a space. 2.7 Introducing innovative daylighting systems: The science of daylighting is not only about providing daylighting into a required space, it is also a process of providing the space with enough light that will not affect the occupants comfort levels. Moreover, it also involves looking further into heat gain and loss, as well as glare control. There are various architectural technologies that comprise the daylighting system. However, not all of the strategies must be present for achieving a daylighting system. The following strategies are provided as an example (WBDG, 2011): Daylight-optimized building footprint Climate-responsive window-to-wall area ratio High-performance glazing Daylighting-optimized fenestration design Skylights (passive or active) Tubular daylight devices (light pipes) Daylight redirection devices (lightshelves) Solar shading devices Daylight-responsive electric lighting controls Daylight-optimized interior design (such as furniture design, space planning, and room surface finishes). Littlefair (1995) proposes that daylighting systems have two main objectives as to attempt to bring natural lighting further into the space, as well as to create a controlled illuminated environment that could serve as a suitable one for occupants. Various numbers of innovative daylighting systems have been researched yet there is a limitation to whether they can serve as potential energy saving devices. 27
43 Innovative daylighting systems are defined as devices that can bring daylight into the indoor environment. They have been divided into two important groups such as light guiding systems and light transport systems Light Guiding Systems: These devices are known to redirect sunlight into the space by either using direct light or diffused light. They can reach up to approximately 8 to 10 metres, whether through reflection, refraction or deflection of light. Various devices are used in different purposes due to the performance required, position, and building type. There are both vertical devices for example laser cut panels and prismatic panels and horizontal elements such as lightshelves Light transport systems: The general idea about light transport systems is that they have the ability to get lighting further and deeper than the light guiding systems. This is because they channel sunlight through the exterior of the building and then disperse into the indoor environment. An example of a light transport device is light pipes. 2.8 Lightshelves Numerous amounts of research papers looked into innovative daylighting systems that have currently been developed. These systems could be of major use when applied to deep plan buildings. (Beltran et al, 1996) expresses that the main aim of most daylighting concepts has been to both control and regulate incoming direct sunlight, and to further reduce its possible undesirable effect of visual comfort and cooling load. However this statement does not deny that daylight is an excellent source of light, when appropriately distributed into the interior space without causing the effect of glare. Kroelinger, (2002) suggests that lightshelves are known to offer not only shading but also redirect the sunlight into a given space. Essentially the main objective behind a lightshelf is to reflect light into the building. A horizontal, or nearly horizontal shape (Littlefair, 1995) usually divides the window into two parts, the upper part of the window, and the lower part of the clerestory. Lightshelves can take place both in the exterior of a building and in the interior of a building or even used both interior and exterior of the building at the same time. Figure 2.2 shows two types of lightshelves. The first one from the top shows a lightshelf with a view window under it, and the second one under illustrates a lightshelf followed by an opaque wall. 28
44 Figure 2.2 Two types of Lightshelves (Littlefair, 1995) Lightshelves are known to offer both shading and a source for redirecting sunlight from a higher position into the space. Lightshelves position and placement may vary depending on the required demands, in which it may be externally or internally, or even placed at both areas. The depth of the lightshelves also depends on the required visual needs, as well as the orientation of the building, and the window height. The ultimate goal is to use lightshelves as a strategy which can help illuminate deeper into the office space, yet at the same time at a controlled brightness level, within the occupants fields of vision. It is important to consider various implications that can have a great significance on daylighting design strategies. 2.9 Lightshelves in Buildings Recent advancements have led architects and the design industry to grow further interest in daylighting and sustainability, hence the wide investment in highly glazed buildings. Utilizing all-glass facades in buildings is a way to help improve the quality of lighting in the indoor environment, however varying temperatures from the exterior environment limit the use of this material. Issues rise with ability to manage varying daylight fluxes, and managing daylighting penetrating into the space. Selkowitz and Lee (1995) 29
45 present a research paper that discusses integrating automated shading devices with daylight controls that in most cases a static fixed control solution will not suffice. It is necessary to provide an active responsive to the outdoor system that can change the interior task required. This is when light sensors step in to add proper functionality. Shading devices can be added along with automated sensors that have the ability to control lighting by maximizing energy efficiency at the same time meeting occupant needs with artificial lighting when sunlight is not sufficient. After attaining a deeper understanding of lightshelves, it is important to summarize the advantages and dis advantages of using lightshelves before considering the best and suitable ways of using lightshelves. Advantages of using Lightshelves: - A major advantage of having lightshelves is the ability of enhancing daylighting and bouncing it back to the space. Daylight is a very effective source of light, and can create a pleasant environment. - Research papers have linked daylighting with increased worker/occupant satisfaction. This means that the inhabitant of the building is comfortable and motivated to work, resulting in increased performance levels. Disadvantages of using Lightshelves: - The major issue with lightshelves is that they are only effective on sunny days. This means that climatic conditions play a major role in affecting the performance of the lightshelf. Also when a sky is affected by clouds, it is called an overcast sky. When this occurs, the lightshelf can penetrate a very small amount of light but not a major amount. In this case, the daylighting level will be low, in which it needs to be supplemented with artificial lighting. - Another issue is that lightshelves may not result in large light illuminances in the occupied space. As stated by Littlefair, (1995) The highest related increases (12-20%) were in situations with a large external obstruction. Assessing lightshelves as part of the innovative systems could decrease energy loads, as well as enhance lighting deeper into the office spaces. Lightshelves are placed internally 30
46 and externally, to make an effort to penetrate most light into the space without creating glare and discomfort Design Strategy and Parameters In order to obtain successful daylighting and electrical lighting results, various considerations and variables must be carried out by the whole building team. Initial considerations must include the decision answering questions such as who will occupy the space, and the required activity and task needed. This is based on lighting preferences that desired by most inhabitants. Conceptually, Kroelinger (2002) suggests that daylighting can be distributed to the interior environment through varied openings on the lightshelf either from the side, from the top, or a combination of the two. In addition, he indicated that building type, height, aspect ratio and massing, dominant climatic conditions, site obstructions, adjacent buildings, and other issues most often drives the choice of strategy. Abdelatia et al (2010) carried out a research that addressed daylighting strategies for sustainable schools in Libya. The main aim was directed at traditional orientations of school buildings. The study focused on daylighting strategies such as providing a good distribution of lighting inside the schools interior in a given space. Another strategy was to protect walls, desks and chalkboards from solar radiation and glare resulting in a negative consequence on the spatial task and activity of the students. The last strategy assessed was controlling the distribution of natural daylight in terms of managing quantity and distribution of light in the school s interior according to occupant needs. However the school had to be supplemented with additional light, such as artificial lighting. This is for night use or to have an additional source of lighting throughout the day. The dimensions for the classrooms were 6meters x 8meters x 3.18 meters high, were inputted into the computer simulation software DIAL- EUROPE. When looking to assess daylight factor (DF) the adequacy of daylight is the main objective. The study resulted in higher values of DF percentages closer to the windows. Additionally the study proved the presence of glare and possibly overheating in the middle of the classrooms. Abdulatia et al (2010) approached the scale model as another tool to assess the study further. The scale model was widely used since 1920 (Willbold G, 1988) to measure and evaluate daylighting. The scale model mimics the design of the actual classroom. This method was preferred over the computer simulations since it takes into results in a better feel and understanding of the interior environment. A major outcome of the study was that the East orientation classrooms benefited most from the sun during morning 31
47 hours. In the morning, the east orientation benefited from higher solar heat gain and low position of the sun. Not many papers agreed with the (DF) approach, Cantin and Dubois (2010) presented a paper on daylight quality based on illuminance, distribution, glare and directivity. These metrics were used to evaluate daylighting quality. The study discussed the limitations that face mostly architects and researchers. The research details that the (DF) is clearly insufficient, and the reason is that the light from the sun and non-overcast skies are not usually taken into consideration. Furthermore, (DF) does not assess room or building orientation. Another issue discussed was mixing both natural lighting and electrical lighting cannot be accurately calculated. The main outcome of the Cantin and Dubois (2010) was that researchers should investigate further and explore other indicators for lighting performance. In addition, other metrics were suggested to replace (DF), such as Useful daylight illuminance metric (UDI) which was previously discussed through several papers and initially starting with Mardaljevic (2006). UDI is defined as the annual occurrence of illuminances across the work plane that are within a range considered useful by occupants Mardaljevic, (2006). Useful daylight illuminance (UDI) a new type of daylight anatomy that simplifies the illuminance data into three simplified categories to what is considered useful by building occupants. These categories are based on detailed surveys and reports that have been carried out on occupant s preference in day lit offices. (Mardaljevic, 2006) The UDI scheme: Lux levels ranging from 100 lux to 2000 lux are considered useful Figures falling short of the useful of lux levels which are less than 100 lux. Lux levels that exceed the useful range are usually greater than 2000 lux. According to research papers addressing building application, the most desired total illuminance level ranges mostly from Lux as well as additional task lighting provided. This is a good figure to keep in mind when designing a space and investigating further into light planning. For research parameter purposes it is of good support to have a valid lux limit to work in between. Although most of the time lighting design is often based on how aesthetically pleasing an environment looks to the designer, as well as the owner of the building. The main issue that rises is that neither does the designer or the building owner is going to occupy and work in the space. How well lighting design supports the performance 32
48 of the office is not made a primary function of an office. The lighting design and system should not require its occupants to reposition monitors, or adjust postures trying to avoid glare. Various research papers investigate daylighting and the use of strategies that improve lighting performance as well as act as a shading device. It is important to maximize knowledge of the strategies before putting them into use, to avoid misguided design errors. In the study done by Jorder et.al. (2009), the aim of the researchers was to investigate the use of lightshelves according to their height to enhance daylighting quality in tropical areas. The study was performed in Bangladesh, precisely looking further into office buildings in the city of Dhaka. The research investigated the most suitable location of lightshelves under overcast sky conditions (Joarder et al, 2009) on the other hand Carbonari, et al, (2002) suggests that the optimal orientation of a building is the one that results in the reduction of the total annual primary energy demand, including artificial lighting and HVAC. It was proved through performing a case study over three different Italian climates. A study that aimed at assessing innovative daylighting systems by Aizlewood, B (1993) in which four systems were investigated. These systems were assessed over a range of sun positions, and varied sky conditions in which performance can be measured. Two offices were put to the experiment, each of them with glazing that faced south orientation. The first office worked well with the placement of innovative lighting system; the second office had conventional glazing. The first system that was tested was lightshelves placed horizontally inside or outside the window. Lightshelves are able to both direct and diffuse light at the same time deeper into the room. The other systems studied were prismatic glazing, mirrored louvers, and prismatic film system. The results of the performance of lightshelves showed that it was one of the simplest systems used in which it provided protection from direct sunlight with only slight reduction in light levels throughout the rest of the room. What could be understood from Aizlewood, (1993) is that he came up with criteria that could define the performance of innovative daylighting systems. The criteria took into consideration the percentage rise in illuminance and the glare index when the system is compared with clear glass. Other researchers aimed to continue Aizlewood s study, such as Moeck (1998) in which he stated that Venetian blind system is a more suitable device that could be used in different office environments. Referring to Moeck s (1998) paper, quantitative and qualitative criteria must be used. The following criterion has been used throughout the study: luminous intensity distribution of the system 33
49 illuminance on the working plane uniformity total light flux entering the space light flux on the upper back part of the space luminance of the window total area of the space that is over-illuminated Spherical illuminance values. Littlefair s (1995) paper investigated computer assessments that analysed lightshelves and other daylighting systems. For this study two different room shapes were selected, the first one a large open plan of 9 meters in depth and 25 meters wide, and the second room, a cellular shaped room of 5 meters with an internal shelf of 1 meter deep. The study further analysed room height and its effect on the investigation, results showed the lightshelves are more effective with higher ceilings by decreasing illuminances more near the window and less at the back of the room, than it usually does with the low ceiling. (Littlefair, 1995) The rest of the results agreed with the Building Research Establishment (BRE) experimental studies in addition to adding recommendations on the performance of lightshelves. The study concluded that lightshelves do not result in large increased in core daylight illuminances. (Littlefair, 1995) Also the study confirmed that lightshelves improve the uniformity of illuminance. Positives outcomes were that lightshelves provide can be used a good shading device especially in hot climates. From the study it was understood that external projection of lightshelves can shade areas closer to the window, while an internal lightshelf can shade areas slightly deeper into the interior environment. Littlefair also confirmed that lightshelves work best at higher ceiling ranging preferably around 3 meters or higher. Another recommendation was that lightshelves should not be placed too deep, in which the depth of the actual lightshelf should be reasonably equalizing the depth of the window. For better results, the lightshelves materials should be as reflective as possible, to be able to have pleasant illuminated interior space. Lightshelves are known to redirect sunlight from windows at different heights, orientations, and latitude. Most common use of lightshelves is external, although internal lightshelves can be effective, as well as using both internal and external strategies could be carried out. The optimum size of lightshelves depends on various considerations that must be looked at. Phillips, (2004) explains that lightshelves are an inexpensive use of building construction that 34
50 can be installed. He stresses that an important factor to consider is that lightshelves do not increase daylight conditions in an environment, but they have the ability to alter the distribution of light. Phillips, (2004) adds that lightshelves can assist in getting light further towards the back of the room so that uniformity is improved. Brown and Dekay, (2001) investigated lightshelves through their book on Sun, Wind, and Light in which they came up with a few parameters to consider. It is stated that lightshelves should be placed as low as possible without interfering with the view through the lower part of the window so that more light can be reflected off the upper side of the shelf and then penetrating deeper into the space. When seeking to reduce solar gains, lightshelves may further be extended beyond the building far enough in order to shade the concerned area. As for reducing glare, the lightshelves should extend further into the inside of the building to able to block the direct sunlight and bright skies. External and internal lightshelves vary in size depending on the orientation. As for the external shelf Brown and Dekay, (2001) state that if the orientation is towards the 20 south (north in the southern hemisphere) the lightshelf should be 1.25, 1.5 times the clerestory. Beyond 20 east or west of south (north in the southern hemisphere), the lightshelf should be then extended to 1.5 or 2.0 times the glass height (Brown and Dekay,2001). Ruck et al, (2000) adds that to enhance lightshelves performance one should alter its inclination during different seasons, as well as proving that lightshelves diffuse light from 5 meters to 10 meters in depth. Beltran et al (1996) presented a paper in the IESNA annual conference that discussed advanced optical daylighting systems written in which it stated that Traditional daylight designs can provide sufficient daylight within 4.6 m (15ft) of the window (Beltran et al 1996). If daylight can be used to balance lighting energy demands over a larger and deeper plan, further energy savings can be achieved. This is to provide higher illuminance levels deeper into the office space during operational working hours of the day. Several research papers express concern over the lightshelves performance in relation to increasing illuminance levels deeper into the plan. It has been well documented that lightshelves can reduce energy consumption and enhance conditions in the indoor environment yet it is restricted. Ochoa and Capeluto (2006) study on evaluating visual comfort and performance daylighting systems for deep office buildings in highly luminous climates study revealed that lightshelves have maximum efficiency when the sun shines 35
51 directly over them. The study showed that lightshelves provide a safer approach by reducing contrast between levels at the view of the window and those at the back of the room, yet sacrificing illuminance. In addition, Soler and Oteiza (1997), and Claros and Soler (2002) looked into lightshelf performance on several solar geometries as well as different surface reflectance s. The two studies revealed that it is necessary to assess the lightshelves design in relation to the size of the room. Other results proved that the lightshelves are majorly dependant on the solar angle, as well day and time, and reflectivity level. Similarly, Freewan, (2010) carried out a study that look at various geometry, as well adding a curved ceiling to asses lightshelf performance. The study focused on two main objectives: determining higher illuminance levels and uniformity of the distribution. Results revealed that the curve shaped lightshelves exploited more daylighting than horizontal shaped lightshelves. This is by bouncing the daylight deeper into the space as well as improving uniformity of the space Problem statement Looking at the competitive and complex world with a rapidly growing population, with constant desires and needs for higher quality of life. Given the environmental, social, and economic issues heading towards current and future, it is vital that the industries play an active role in directing and guiding most of its processes towards the sustainable design. When looking at ways to enhance buildings in the city of Dubai, it is important to look the existing factors and used as an advantage. As a hot and dry region known for its heat and extreme sunny days, as inhabitants of the city of Dubai one cannot help but try to find solutions to take advantage of the sun. The sun is a blessing that can be much used for the benefits it provides, one of them being light. Since the construction industry has been developing itself majorly day by day, there is a limitation to the considerations adopted in the building and construction industry. Maximising the use of daylight into buildings without comprising people and creating discomfort is necessary, but is yet to be a challenge. Today, artificial lighting is held accountable for consuming an enormous amount of energy in buildings all around the world. Luckily, much advancement in lighting design has contributed to mitigating this issue. Research has proved that energy efficiency in a lighting system can be achieved primarily when decreasing two important variables: the lighting power density and the lighting system being used. Therefore it is important to look into further advancements, as well analysing climate conditions. When designing a space, many factors play a major role in affecting the indoor environment. As designers, a vital responsibility that 36
52 must be looked at and assessed carefully when determining what works best. As the world witnesses the enormous amounts of environmental concerns, one cannot help but start to pay attention to sustainable notions that could help enhance and shield human comfort Aims and Objectives The reduction in the use of energy consumption in office buildings has been established as major objective to carry out this research paper. The idea is to attempt to expand daylight illumination into offices. The study will look into deep plan offices in order to obtain similar results that can be comparable. The challenge is to provide adequate lighting and at the same time reduce the need for artificial lighting. By using advanced lighting techniques known as Lightshelves, the study will assess and analyse different variables with an aim to provide the optimum daylight exposure. Aim - The purpose of the research is to study the potential for increasing daylight in deep plan office buildings by using lightshelves as a technique of natural light usage and impact on energy efficiency. Main objectives: To look at different configurations of lightshelves as an effective technique that can be used to enhance natural lighting in offices. Investigate into what makes a good daylight design, and what could be reliable. As well as suggest better ways to design offices effectively. Be able to input an interface between daylighting and artificial lighting, in which a sensor could be used in the simulation process. Configure a dimming profile that will work during occupied hours. During nonoccupancy hours lights will be switched off completely. Assess the energy savings (direct and indirect) that could be achieved by employing lightshelves into different deep plan office alternatives. Recommend the optimal orientation, lightshelf height, and depth within the space for most ideal daylight exposure, while keeping in mind energy consumption levels. 37
53 CHAPTER 3 METHODOLOGY 38
54 3.1 Method selection: It is important for the researcher to select the most suitable methodology for the research aims and objectives. Comparing and contrasting between various methodologies that have been used is a crucial part of the research. Considerations of certain aspects rather point to reflect on to a perfect chosen methodology. These considerations are for example: (i) what is the most suitable and appropriate method for the study? (ii) How accurate can the results be obtained for this research? (iii) Efficiency of the method being used. As well as other considerations that could affect the research paper. 3.2 Methods that Assess Lighting Energy Consumption: Monitoring and observing method: Onaygil and Guler, 2003 presented a great example of a monitoring approach that was carried out in Turkey. The study was aimed at assessing energy consumption levels saved by daylight responsive lighting control system when compared to artificial lighting data. The study duration took one year of monitoring and implementation. The setup was by using a four story building with dimensions of: 3.35m x 6.25m x 3.25m, orientations of the office faced the north-east. According to various studies that stated the most effective window area would be around 2.4m2 with a height of 0.72m. The study further tested different zones, as well as the ceiling was color white, with grey walls. Several sensors were placed in the office, vertically and horizontally. Data collected during the period of one year was assessed and examined. The results of the study demonstrated light savings reaching 20% in December, which increased to 47% in June and July. It is shown from the study that energy consumption is very much related to climate changes in different locations. However energy savings gathered by the automation systems are separate from the types of the luminaires, light sources and the other electronic components. Levels may reach up to 30% which is very important when looking into energy saving. (Onaygil and Guler, 2003) Lee and Selkowitz (2004) monitored the performance of the daylighting systems in The New York Times headquarters. The study duration took 9 months, in which a mock-up was made to mimic the headquarters. Two different areas were divided one that has 0-10 V dimmable ballasts with an open loop control system and a shading device. The second area consisted of a digital addressable lighting interface and a shading device. The daylighting and energy 39
55 consumption was measured. The second room showed large savings since it was facing the south orientation and had an automated lighting control system. Experimental (Scale model) Method: Kim and Kim, (2007) presented a full scale mock-up was built to assess daylight fluctuations on the variation of illuminance which was controlled by a dimming system that was installed. The study took place in the Ann Arbor, MI, USA, the lighting used for the study was parabolic fluorescent lighting, as well as T8 lamps. The space built was based on a small office space tested under various daylight conditions. This type of study is considered to be a big scale model since it mimics actual office space, into building an actual mock-up in representation of the study. The changed in illuminance and lighting levels were investigated according to photosensors shielding conditions and blind angles. Chen et al, (2005) investigated the use of shading devices as a component to enhance natural lighting in building design. The research took place in Taiwan, a hot and humid weather condition, the study focused on mainly the function of light redirection of shading devices. This mainly happens when a vertical shading device tends to reflect daylight, and promotes daylighting in a space. The study carried out presented a mini scale model (1:20) which assessed modeling data, and suggested measures that can be used for both the end user and designers for vertical shading devices. The study verified the use of mini-scaled models, in terms of assessing and investigating further into natural daylight utilisation, as well as energy conservation in buildings. Hansen et al (2003) carried out a research paper that looked into light pipes in deep plan office buildings. The paper further asses light pipes as an advanced technique that could enhance daylighting penetration into deep plan offices. The test occurred under sunny sky conditions as well as an artificial sky that mimics the exact CIE overcast sky in Malaysia. The scale model consisted of two types one that represented a horizontal light pipe and the second a vertical light pipe. The results revealed that mirrored light pipes have gained a higher concentration of illumination deeper into the building under sunny conditions. The overall performance of the light pipes decreases under overcast skies. Freewan et al (2008) investigated the influence of ceiling geometry on the performance of lightshelves. The study explored both physical model experiments and then imported to 40
56 radiance to preform further simulations. Two 1:10 scale models were created in the following dimensions: 8 meters long 6 meters wide and 3.25 meters high. These models served as rooms that have lightshelves placed, one room with a horizontal ceiling and the other in a curved ceiling. The overall reflectance value was set to 70% and 35% respectively. In addition to adding 4 illuminance sensors made out of silicon photocells with a work range of Lux was set. The study revealed that performance of the lightshelves can vary when changing the ceiling geometry. This is because the study demonstrated that the illuminance level has closer to the rear of the room and was reduced closer to the the window compared to rooms that having conventional horizontal ceilings. Chou (2004) presents a paper that assess between daylighting performance and shading device design in buildings in subtropical conditions. Scale models took place in Tamkang University Laboratory. Devices such as: 16 Minolta NT-1 luminance meter, a gloss-meter and reflectance meter as well as TEAC DR-F1 digital recorders were used and tested under Skydome that enabled testing daylight performance levels. The study revealed that various variables play a significant role in the fenestration design being tested for example the opening ratio, and the type of shading device, as well openings amount selected. Belran et al (1997) revealed a scale model study that examined two different types of advanced daylighting systems: Lightshelves and light pipes. All of the prototypes were selected to match Los Angeles. The main objected was to find the optimum approach that would take advantage of the sun. The study concluded that both advanced system can provide suitable lighting for office tasks, yet the light pipe proved to be more efficient throughout the course of a year compared to the lightshelves performance. Computer Simulation Method: Bodart and Herde (2001) offered a research paper that studied lighting energy savings on global energy consumptions in office buildings. The evaluation was carried out by using the simulation method set out in Belgium and performed on (TRNSYS) and (ADELINE) simulation software. Four rooms were modelled in the following measurements: width of 2.7, 3.6 and 5.4 meters, depth of 5.4, and height of 3 meters. Nine different window settings were examined for each room plan size. Results from the research were achieved and proved that light consumption can be reduced by using daylighting from 50 to 80%. 41
57 Jorder et.al. (2009) research studied the use of lightshelves in office buildings the city of Dhaka, Bangladesh. The researchers modelled six different 3D models using the software Ecotect; these models were then moved to Radiance to generate realistic imagery. The study was comprehensive and examined different heights of lightshelves and measured their effectiveness. The results varied in terms of achieving different lighting levels. Lightshelves at a height of 2 meters above floor level was proven to perform better amid the seven options studied including the alternative model where no light shelves are present. Kim et al (2012) investigated shading systems and the optimum way of increasing daylight levels in apartment buildings in South Korea. The study was carried out using the energy program IES-VE to calculate heating and cooling. The total area of the space examined was 145meters2, a height of 2.3 meters. The study revealed that external devices are far more effective and efficient compared to internal devices. Other adjustments to the shading devices such as slat angles can be very advantageous, as well as creating enhanced view. Roisin et al (2008) studied lighting energy savings in offices using different control systems and their real consumption. The study used DAYSIM software for the simulation process to calculate daylighting levels and to gain energy consumption levels. This simulation software consisted of precise dynamic daylight simulation, which relied on radiance algorithm. Configurations of the model were: office setting width of 3.05 meters, length 6.55 meters and a height of 3.05 meters. The room was tested to four different orientations (north, south, east, and west) taking place in Brussels and Stockholm. The study showed a great potential in energy savings when having control over the electrical power. The study allowed for major savings that estimated around 45% to 61%, with occupancy sensors that have been added to the study. Mohelnikova and Vajkay (2008) assessed internal illuminance calculations under two different extreme conditions, one was sunny sky and the other condition was an overcast sky. The study used Desktop Radiance 2.0b and Ecotect 5.20b for the simulation. The floor area tested measured 4 meters by 16 meters and height of 3 meters. Light guides with 0.6, 0.8 and 1 meter in diameter were added to determine their performance when substituting them for windows. The results revealed that light guides may not substitute traditional windows. The study also showed that differences in the illuminance level of the interior environment with light guides, in which they definitely improved visual comfort. 42
58 Subjective Evaluation (survey): A study carried out by Osterhaus, (2004) represented the issue of glare, and discomfort it brings out to the occupants existing in an environment. The paper looks closely at the advantages and disadvantages of glare indices for daylighting conditions. On a period of two years, a survey was distributed in Germany and California, USA, to assess visual comfort in day lit office spaces. A total of two hundred and fifty participants took part, in which most of them were exposed to daylighting through windows in the offices. However results show that there are a lot of ground to be covered to completely understand and comprehend the essential principles and mechanisms that are considered responsible for the perception of discomfort glare from windows and the occupant responses to the amenities of daylight. (Osterhaus, 2004) Figure 3.1 Daylight factors (%) in the example rooms with varying external lightshelf (Osterhaus, 2004) Figure 3.1 compares over cast performance of dark shelves with the same size lightshelf evaluated in a previous part of the study. The study showed low reflectance shelf resulting in 10% lower rate compared to high reflectance shelf. The table also shows different external lightshelves reflecting into the interior space, with diverse reflectance degrees in contrast with distance from window measurements. The amount of daylighting illuminating the space decreases as it goes deeper into the space. 43
59 Hua et al (2010) assessed the effectiveness of daylighting design and occupant visual satisfaction in a LEED gold laboratory building. The study was a combination of multiple methods that took part: occupant surveys, interviews, and illuminance measurements. A web based survey was carried out and distributed to 75 occupants of the buildings to gain input over occupant satisfaction levels. Additionaly, the study also include pre-survey checklist that has been designed for occupants of the building. Results of the study showed the most of the occupants have been satisfied with the indoor environment, yet glare was addressed to be a major problem for occupant visual comfort. Some occupants also expressed that some lighting in the indoor environment is very bright during the day. Galasiu and Reinhart (2008) studied current daylighting design practices. A survey was carried out to help look at daylight performance indicators and other tools currently being used by design professionals. In addition, to enhance the information available and recommended further applications in relation to design guides. The survey obtained was distributed to 177 professionals. The survey concluded that there is no common and mutual method on how to asses lighting performance and quality as well as energy consumption, daylight factor, and glare. 3.3 Advantages and Disadvantages of Different Methods: From the previous unit that consisted of a review of literature, it was made clear that the simulation method was the one most used methods to assess energy. There are three different methodologies to assess light performance and efficiency, which are observation and monitoring method, experimental method, and computer simulation. It is important to further look in depth at the advantages and the disadvantages each method to select one of these methods. During the selection process the more methods looked at and assessed, the easier it is to justify the selected study carried out. Monitoring and Observing Study: It was made clear that the monitoring and observing type of method examines existing building that has been constructed based on realistic environmental measures. Most assessments made from this type of method are considered accurate, since the assessment takes into consideration realistic measures and design factors already playing part. Results gathered do not require any sort of calculation to be performed on simulation process to examine and work with. Although there seems to various benefits from the monitoring and 44
60 observing method, there are some concerns that stir up. This method can be very time consuming for the process of gathering data and assessments, which can be an issue if the researcher is restricted to a certain time frame. Another issue is that it can be costly in where there could be other methods that could perform in a cost effective way and in a timely matter at the same time. Results gathered from this approach are based usually on a single profile/ or case study, which means that it stirs up a major concern when generating a hypothesis. This is because of the limitation of the study to one case, or the cases being studied. Experimental Method: This method looks closer at portraying the building targeting for the study, this depiction is made through a type of mock up. A mock up is considered a type of prototype, which can provide an understanding functionality of the system investigated. It is usually made for buildings to test and get feedback from people. This method may consume numerous amounts of money, as well as it could be very time consuming for those carrying out a research in a strict time frame. Calculations obtained can be both confusing, which may result in leaving some information out. Computer Modeling Method: Computer modeling methods are usually carried out using computerized software s as a tool that has the ability to assess various types of building structures in all forms. These software s can be both easy and challenging at the same time. In terms of predicting energy consumption, these types of software s are fast and time efficient and most of the time very accessible. Many concerns debated the issue of reliability and accuracy in terms accurate figures obtained. Hence, the huge improvements that have been integrated into programs that made them as consistent as possible. An important benefit to pursuing computer modeling method is that when a study is carried out, it is very quick and fast process to test different variables, and make changes. This means that there is more room for trial and error, as well reaching out to the conclusions expected from a certain study. With the ability of accessing weather data files and conditions, it became easier to obtain and test models on information based on realistic measures. Though in order to get accurate results on a specific study, it is important to input all of the variables taking place, which is preforming an exact simulation. There are many advantages to using the simulation modeling approach; however in any method there is always room for things to go wrong. This is because no matter how much computer software is integrated with all types of technology, sometimes there are hidden 45
61 variables that could affect a study in real life, yet not be present as one of the options in the modeling program. Additionally, it is very crucial for the weather files and data to be updated because a lot of the time data will be inputted and not changed for years which results in inaccurate predictions. Subjective Evaluation (survey): The subjective evaluation is carried out most of the time to understand the perception of people s viewpoint of current understanding on a certain subject. It can be done through various approaches such as surveys, interviews, and case studies. This type of approach is more of an occupant s personal perception and view towards the evaluation investigated. Many views can be obtained, and may seem very credible, since they are taken from actual data input, and how people feel and react towards a certain type of study. The only issue with such method to be carried out is that it may be very limited due to the variation in amount of data collection, as well as varied viewpoints from different individuals. The analysis may be questionable, due to various modes of evaluation, which may be correct or incorrect. When studying lightshelves it is going to be hard to assess occupant understanding due to the limitation of the current technology and lighting design. It would be more appropriate to test occupant performance levels after the building has been built, and the lightshelves have been placed. However it is more suitable to approach other methods for preliminary stages of the design process. 3.4 Comparison Between Different Methods After assessing the different types of methods, and looking at diverse advantages and disadvantages, it became easier to compare and contrast between each method, before finalizing the method should be carried out for the research. A table was created in order to justify different criteria and compare them with each other. Table 3.1 Comparison of Different Methods Criteria Monitoring method Experimental method Simulation Method Survey Time Time efficient consuming Costly Cost effective Cost 46
62 effective Accuracy Accurate Not as accurate Accurate Flexibility Not flexible Not flexible Not flexible Experience needed Learning the software The table 3.1 presents a few criteria that have been selected to make it easier to compare and contrast between each type of method. Time consuming: It was made clear that both methods of monitoring and experimental and subjective evaluations approaches are time consuming compared to the computer simulation method. This is because building a mock up for example of a building consumes enormous efforts. As well as taking a certain building as case study could take long periods of time in order to collect a good amount of buildings to assess together. Cost: The amount of money required to purchase the modeling software is adequate compared to the funds needed for building a scale mock-up. Although the cost of surveys and interviews is very low. Accuracy: An important aspect to consider is that both monitoring approach and experimenting methods are very accurate because they are based on real exact figures. Although there are efforts taken towards making new software s more advanced and more accurate. Flexible: the most flexible method is the computer simulation method, this is because data inputted into the program can be easily accessed and changed whenever required. This approach challenges the research to further advance and excels in researching because it allows testing under various conditions. In addition, allowing more room for trial and error to occur. Experience needed: It is important to be experienced to carry out an experimental method, this is because an experienced individual will consider various concerns that an inexperienced 47
63 person wouldn t notice. As for the computer simulation, it is a matter of learning the software and there many tutorials that are accessible for everyone. 3.5 Method Selection It is important to consider applying various environmental techniques that would help reduce energy consumption. These techniques should take into consideration lighting levels, as well find ways to reduce the electricity. Advancements in the industry are rising towards computer simulation software s that are able to help measure various design considerations. These computer software s have bigger advantages to the design industry since studies and considerations are obtained at a beginning stage of the design. Not only are the computer modeling programs are able to simulate, they are also capable of calculating input in terms of climate change all year round. Calculations can provide the design industry with accurate and reliable data on thermal performance, visual comfort levels, as well as energy consumption. With much computer and technology advancements there are software s that provide the design industry with very precise calculations. Computer simulation and modelling method is considered to be the most efficient, when measuring energy consumption and light density of buildings. Over the past 50 years, hundreds of building energy programs have been developed, enhanced, and is at use throughout the building industry. (Crawley, et al, 2005) The main objective of the simulation software is to offer users with building performance data information such as energy usage, demand, temperature, humidity, and costs. After comparing and contrasting methods within the study parameters, it became clear that the computer simulation method was most suitable and appropriate to pursue. This is due to many reasons; control over variables is easily obtained when selecting computer simulation method, as well as the flexibility in inputting data, and changing information. This method also allows more room for further tests, and investigations from different angles. Funding of the computer simulation program is considered manageable compared to other methods that could be taken. The computer simulation method along with literature review selected (previous chapter) helps acquire most information needed about the study of enhancing daylighting in office buildings by using lightshelves. An important advantage to the computer simulation study is that it is possible to examine lighting situation for different periods of the year. This is done by assigning specific parameters like: date, time, location, and season. Additional methods tend to require extra time, funding, and experience. 48
64 This section of the paper, will further investigate into computer modelling software s with the ability to calculate energy consumption in buildings. Due to the specific research study parameters that examines the use of lightshelves in a space, and testing energy consumption it reduces the amount of software s to select from. The first program examined was ECOTECT, available at is known for its visual performance analysis functions with ability to look into energy, lighting, shading, acoustics, and resource usages. This software can handle different types of structures regardless of the complex forms, or different size. One of the main objectives of this program is to insure designers with advantageous performance feedback, and to be able to visualize projects. ECOTECT is also capable of importing and exporting models from other design software s, as well as perform the modelling process within the software. The program is fairly flexible in terms of changing and controlling various parameters, zone settings, as well as material. Calculations and result can be determined according to day to day measurements or all year round statistics. The second program assessed was IES VE which is available on and stands for Integrated Environmental Solutions. It comprises of modules, each of these different modules acts in a different way to the specific calculations required. This program aims to provide a wide range of building analysis in a single software environment. These modules are Apachesim used for thermal simulation analysis, Radiance for lighting simulation analysis, Mechanical for mechanical simulation analysis, and SunCast for solar shading analysis. (Crawley et al, 2005) IES VE allows professionals to obtain detailed information on building design and system performance in which it would allow access to comfort measures as well as energy use. Figure 3.2 and 3.3 compares and contrasts between different simulation programs in terms of building envelope, daylighting and solar analysis, sky models, and daylighting illuminance. 49


65 Figure 3.2 Building envelope and daylighting comparison (Crawley et al, 2005) 50
66 Figure 3.3 Daylighting comparison (Crawley et al, 2005) Figure 3.2 outlined various software s available such as: BLAST, BSim, DeST, DOE-2.1E, ECOTECT, Ener-Win, Energy Express, Energy-10, EnergyPlus, equest, ESP-r, IDA ICE, IES <VE>, HAP, HEED, PowerDomus, SUNREAL, Tas, TRACE, and TRNSYS (Crawley et. al., 2008) and looked at solar radiation and daylighting. 3.6 Selection of Simulation Tool After comparing and contrasting various computer software s it important to ensure that these software s aim to measuring the amount of daylight penetrating into the space, energy consumption, and light intensity in office spaces. This is since the study is specific and focuses on a certain subject. When Daylight simulation is used, it allows studying effects and changes in any one aspect, keeping other aspects constant. At the same time with new technology advancing in software applications it became easier to test models according to real weather conditions, and taking into considerations realistic measures. The comparison done in the previous section made it clear to select which software to carry out during the study of lightshelves and energy performance in buildings. (IES) Integrated Environmental Solutions will be the software selected for the study, and the next section will look deeper into the software s properties and capabilities, and the results that could be reached from the research Integrated Environmental Solutions Integrated Environmental Solution is a virtual software that compiles a highly integrated collection of applications linked together. The software consists of different modules to assess specific calculations such as thermal simulations, lighting, mechanical, and solar shading simulations. The software offers a virtual environment to obtain detailed analysis and evaluation of various buildings, systems, and designs. These evaluations are allowed to be test according to many criteria s such as comfort, and energy use. Glasgow-based (IES) started its software in 1994, and offered a range of applications to evaluate a wide range of building performances. These ranges of performances are formed to provide sustainable solutions for the initial design processes. Different parameters can be selected when using this software, such as location, specifying materials, usages of spaces, as well as alter HVAC systems according to required needs and preferences. IES includes different utilities as well such as a modeling builder, Energy, Solar, Lighting, Cost and Value, Egress, Mechanical, as well as CFD. The following utilities are a very beneficial since they are dedicated to offer 51
67 explicit objectives for the researcher. Since the research field looks into both daylighting and energy use, this program is most suitable to use Validity and Reliability A significant advantage to using simulation software for a research is when assessing different lighting situations for various periods of the year; the software s has the capability to assign various parameters such as location, as well as date, timing and sky condition. This is very crucial to have since it s the most information that matters to carry out a study. An attempt to insure validity and reliability of the software program selected is made. A case study is used in order to test and simulate the same climatic condition, as well as orientation, in order to reach same or similar results. Joarder et al (2009) presented a paper that addressed daylighting assessments according to the height of light shelves. The study looks at enhancing daylighting quality in tropical climates in the city of Dhaka, Bangladesh. The main aim of the study was to show the effectiveness of the lightshelves to the interior quality. Six different modules were assessed and generated used Ecotect for the simulation. Radiance was also used to be able to validate the study. The following data have been derived from Joarder et al (2009) research in order to perform the validation process. Location of the study: Dhaka, Bangladesh.(90.40 E, N) Calculation Settings: Full Daylight Analysis Sky Illumination Model: CIE Overcast Dimensions of the space: 25m x 28.5m Total floor area: 692 sqm Usable office space: 577 sqm Service area: 115 sqm Height of office space: 3m Window to floor ratio: 0.36 Work Plane height: 0.75m The following materials used: 52
. Lightshelf height: 2.75m,2.50m,2.25m, 2m, 1.75m, 1.")

68 Ceiling/ Roof: White painted plaster (reflectance: 0.7). Internal wall: White painted brickwork (reflectance: 0.7). Floor: Reddish ceramic tiles finishes (reflectance: 0.6). Glazing: Single pane of glass with aluminium frame (reflectance: 0.92, U value: 6W/m2K). Lightshelf height: 2.75m,2.50m,2.25m, 2m, 1.75m, 1.50m The following parameters were inputted into the IES-VE software in order to reach similar results. The lightshelf height of 2 meter has been the module that was experimented with. Figure 3.4 Ecotect Daylight Analysis Figure 3.5 IESVE Daylight Analysis Figure 3.4 and Figure 3.5 shows the 2 m height of the lightshelf that has been placed on the office module. As seen colors closer to the window shows brighter shades of yellow. As light penetrates further there s an average of around 300 lux in the overall of the room. The simulation made in IES has reconfirmed the ECOTECT and RADIANCE studies that were performed in the original studies that showed lux shown in figure
69 Results confirmed similarity in results from the study in order to illustrate the software s reliability. 3.7 Defining Research Parameters: The research s parameters will help obtain the final results. Some of the parameters would remain constant others will vary depending on the objective trying to reach. After investigating various research papers, it was easier to set out parameters to work with. Constant parameters: Climatic Data: The outdoor environment has a major significance in affecting the user s performance. This is due to the daylight intensity coming from the sun. This research looks into enhancing daylighting in office buildings by using lightshelves. In which, light intensity from the sun should be suitable for the research to be carried out. Building Usage Data: The type of practise occurring in a space defines the kind of utilisations required. This is most crucial when looking into lighting decisions, in which activities/tasks are major influences taking part in the decision making process of the design. Various internal factors affect occupants in any environment. Variables: Design Data: The choices selected throughout the design process have the most influence on the buildings energy consumption. For architectural design the following variables were to be studied: Orientation of the building: The orientation of a building is one of the most important variables in the design process. This is because in order to understand the study, and compare and contrast results it 54
70 is vital to look at experiment from various aspects. Orientations include North, East West, and South sides that could be examined. Results obtained will determine the optimum orientation that would maximise the use of daylighting at the same time reduce energy consumption loads in the spaces selected. By studying the four facades the effect of the orientation of the building on energy will be examined. This test will enable the study to provide information on the optimum orientation which suits the building. Space chosen: There are going to be four different office plans presented. The study will be based on trying to provide lighting deeper into the space for more daylight illumination. Office timings: A crucial part of the research is setting the buildings occupancy timing. This is to depict the exact office hours that are considered realistic. A general idea of the working days of the week is usually five-day work week Sunday through Thursday. This is to consider that the study set will be based on the working hours of the week, where energy is consumed most of the time. Materials Data: The selection of materials in a study is a very crucial step in order to get valid results. Opaque construction materials: Types of materials that are going obtained for the Roof, Ceiling, External and internal walls, flooring, and doors. This information also includes glazing types for internal and external areas, as well as roof light. These materials may affect the experiment slightly, but results vary most of the time in larger amounts accumulated. Light shelve materials: This section of the study will include light shelve variables such as: location, opening type as well as number of openings placed in the office. In addition to the internal and external depth the lightshelves extends onto the space selected. 55
71 CHAPTER 4: BUILDING THE SIMULATION MODELS 56
72 4.1 Introduction: The previous chapters carried out provided a foundation for the study, in which delivered great evidence of research and results that would support the research question. The following chapter addresses the research matrix, parameters, as well as the scenarios decided on for the modelling process. The simulation process involves creating a virtual environment that depicts the original setting for example: climate and various parameters that could be inputted in order to obtain reliable results. The results obtained from the study went through various stages of modeling in order to reach accurate results. Is crucial to provide the essential information inputted in order to compare and contrast different parameters. In addition, to familiarize the reader with the different scenarios tested to reach effective results. 4.2 Parameters of the Base Cases Assigning Weather Data: The city of Dubai has been chosen for this study, since the sun is bright and daylight is present throughout the year, it is suitable to take Dubai as a case study. IES<VE> weather data are attained from ASHRAE weather Database, In which the Dubai International Airport was selected for the study. The file was accessed through the Aplocate tab. The file consists of different information on Location and site data. The following information was selected for Dubai, United Arab Emirates: - Longitude: E - Latitude: N - Altitude: 5 meters above sea level - Ground reflectance: 0.20 Dubai s Climate: Dubai s climate is considered very hot, in which summer temperatures can easily extend to 42 C. Winters in Dubai are usually warm with temperatures averaging from 29 C. The table below presents an estimate on temperature records throughout the year. Humidity is also one of the eminent things Dubai is known for. (You may refer to Table 4.2 for graphs that clarify Dubai s sun bath, dry-bulb and wet bulb temperature, solar altitude, solar azimuth, direct 57
73 radiation, relative humidity, wind speed and cloud cover.) Table 4.1 and 4.2 present weather data that has been obtained from the IES-VE database, according to Dubai, United Arab Emirates weather conditions. Table 4.1 Design Weather Data (IES-VE database) Design Weather Data Design Weather Data Source & Statistics Source of Design Weather ASHRAE weather location Monthly percentile for Heating Loads design weather Monthly percentile for Cooling Loads design weather Heating Loads Weather Data Outdoor Winter Design Temperature Cooling Loads Weather Data Max. Outside Dry-Bulb Max. Outside Wet-Bulb ASHRAE design weather database Dubai Intl Airport, United Arab Emirates 99.6 % 0.4 % C C C Table 4.2 Weather Model Data (IES-VE database) Weather model data Temperature Humidity Solar Radiation Dry bulb T Min Dry bulb T Max Wet bulb T at Max Linke Turbidity Factor dry bulb ( C) ( C) ( C) Jan Feb Mar Apr May
74 Jun Jul Aug Sep Oct Nov Dec Building Usage Data: An important section of the research where most lighting decisions are made, this is because the major activities and tasks that occur in a certain environment are mostly affected by lighting. It was proven by various research papers that office buildings are most energy consumers. Therefore, the study was set on examining office buildings. IESVE provides the user a series of tabs that could determine custom operations. For example: this utility enables the user to provide specific timings for plan equipment to operate. In addition to customizing various internal and external heat gains as well as specify time intervals for them. Table 4.2 and 4.3 show the internal and external source of heat. In this study three different source of heat were inputted into the IESVE: Fluorescent lighting, people, and miscellaneous. Since fluorescent lighting is mostly used in office buildings, it was selected for the study. The following values were entered: Max. Sensible Gain W/m 2 Max. Power W/m 2 with a radiant fraction of The second source of heat that was selected for the study was people with the following data: sensible heat gain of73.268w/m 2. Other sources of internal heat were set to miscellaneous with a sensible gain of W/ m 2. As for the external heat gains presented in table 4.3 infiltration was set to be the source of external gains with a maximum flow of Other room conditions took into consideration that the heating profiles are off continuously since the UAE is a hot and humid climate that does not require heating. As for the cooling profile it was set as part of ASHRAE 8am-6pm with a constant cooling set point of 23.9 C. Internal gains: 59
75 Table 4.3: Internal Gains of Heat Type Max. Sensible Gain Max.Latent Gain Occupan cy Max. Power Radiant Fraction Fuel Variatio n Profile Fluorescent lighting W/m 2 m2/per Electricit W/m 2 y (8 till 6) People W/m W/per. 10m 2 /per (8 till 6) Miscellaneous W/m 2 W/m 2 y Electricit (8 till 6) External gains: Table 4.4: External Gains of Heat Type Max. Flow Unit Variation Profile Infiltration Ach On continuously Occupancy schedule: Office working hours in a typical office is considered to be 8AM to 6PM. As for Dubai the working days are from Sunday through Thursday in which most energy consumption occurs. Office hours have been imported from the IESVE database that provides built-in profiles that could be inputted. (Modulating Profiles) ASHRAE 8am - 6pm No Lunch/ Sun- Thursday Figure 4.4 shows the occupancy and lighting schedule that was set for Sunday through Thursday, as illustrated the working hours of the day are set from 8am to 6pm, where lighting and energy is at use. Figure 4.5 shows the occupancy and lighting schedule for Friday and Saturday when there is no working hours, and the energy is not consumed. 60


76 Figure 4.1 Occupancy and lighting schedule Sun-Thursday Figure 4.2 Occupancy and lighting schedule set for Friday and Saturday 4.3 Variables: Most of the variables are design data chosen throughout the study which has most impact on the energy consumption. The following variables are discussed in detail, as well as proving the exact input inserted into IESVE Area of Focus Every valid research must have an area of focus, and certain parameters to test and examine. Table 4.5 presents the research parameters selected (marked in red). These parameters 61
77 consist of climatic data based on the setting of the study. Design data of the model such as the orientation of the model looked at, as well as the plan size. Other data examined are the Lightshelves that are placed, while listing the configurations for them such as the height of placement, interior and exterior projection and number of openings. Table 4.5 Base Cases Climatic Data Design Data Lightshelf Data Orientation Plan depth # of openings Height Exterior Projection Interior Depth Dubai, UAE East 5x5m x10 South m West 5x15 m Orientation of the building: Looking at the model from different aspects is setting different building orientations. As for the study East, South, West orientations are selected, as well as placing lightshelves and a glass opening on the side studied. The South Orientation of the building will be the base case for the study. Figure 4.1 provides an example of the East side of the building, the lightshelf placed over the window. Eastern orientation is expected to get daylight in the early hours of the day. As for the Southern window it is expected to have less daylight compared to the east orientation due to the higher solar angles for a longer period of time. 62

78 5m 10m Figure 4.3 3D Model Space chosen: Three alternate office plans presented. Plans dimensions are 5x5meters, 5x10 meters, 5x15 meters, and height of 3 meters. The 5x10 meters plan will be the base model and focus of the study. In which most of the analysis will be contrasted in depth in comparison to the 10 meter base model. Figure 4.2 shows the base case plan. The bigger and deeper the plan the more the challenge for daylight to be able to illuminate the whole space as well as provide adequate working environment. Figure 4.4 Plan (left) and Section (right) 10 meters 4.4 Module Materials and Finishes Data: The selection of materials in a study could be one of the final steps before preforming the simulation. The light shelves material consists of aluminium Opaque Construction Materials: 63
79 Table 4.6 Opaque construction materials Opaque material U-value W/m Roof Flat roof (2002 regs) Ceiling Carpeted 100mm reinforced-concrete ceiling External Wall Standard wall construction (2002 regs) Ground Floor Standard floor construction (2002 regs) Table 4.7 Glazed Materials Glazed U-value Total shading coefficient External Glazing Low-e double glazing (6mm+6mm) (2002 regs) Lightshelf Materials: This section of the study will include light shelve variables such as: location, opening type as well as number of openings placed in the office. In addition to the internal and external depth the lightshelves extends onto the space selected. Reflectance value: Default reflectance values were used for ceiling, walls and floors in the model Lightshelf Height: Height of the lightshelves will vary according to table 4.5, the dimensions going to be selected are: 0.5m, 1m, 1.5m Number of Lightshelf Openings As for the lightshelves, different approaches may enhance daylight penetration deeper into the space. The research looks at introducing openings into the lightshelves, this occurs in order for the light to illuminate certain areas and redirect the rest of the light through the 64
80 shelf. The base case scenario is going to have one opening in each lightshelf tested. Other tests will test two openings and three openings in each shelf in order to attain the best results. 4.5 Energy Conservation Measures: In order to decrease the cooling load and the lighting energy daylighting dimming sensors were incorporated into the model with the following logic. Daily DIM - ramp(e1,0,1.0,300,0.2) Figure 4.5 Dimming Graph Ramp: The ramp basically allows the lights to dim when enough daylight is illuminating the space. It activates through RADIANCE, and the dimming of the electrical lights will occur when the sensor is fully working. Ramp (e1, 0,1.0,300,0.2) is explained as when daylight levels reach 300 lux at the sensor, the lights are dimmed to 20% in a sloping profile. Sensors: 65
81 Three sensors were placed to show the effects of the proximity of the window to the center of the office space and to the end of the room. The sensors were placed at 0.85 heights which were assumed to be the working plane. Figure 4.11 demonstrates the sensor placement in the model. Figure 4.6 Sensors in the Plan Basis of analysis: Lights energy, chillers energy, and daylight levels are going to be looked at in each annual study. Annual energy consumption totals kwh Hourly peak data kw Instantaneously daylight levels (lux) 4.6 Office Modules This is section of the paper will look at the various office modules that are going to be studied and analysed in the succeeding chapter. Both a plan and a 3D model will illustrate each study based on the parameters in Table


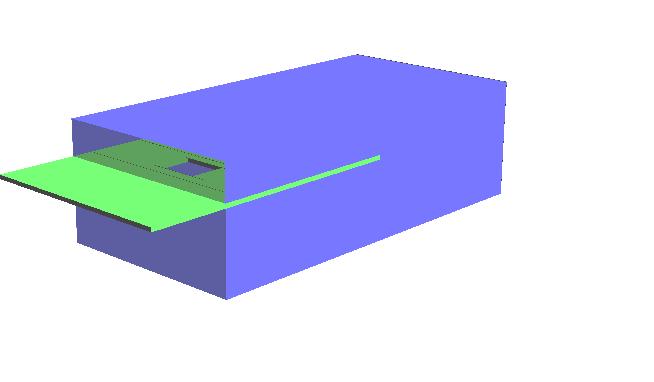
82 Figure 4.7 East orientation plan and 3D Figure 4.8 South orientation plan and 3D: Figure 4.9 West orientation plan and 3D 67


83 Figure x5 plan and 3D Figure x15 m plan and 3D 68


84 Figure Openings Plan and 3D Figure Openings Plan and 3D Figure m Height plan and 3D 69


85 Figure m Height of LS Figure m Exterior Projection Figure m Exterior Projection 70


86 Figure Interior Depth Figure Interior Depth 71
87 CHAPTER 5: RESULTS AND DISCUSSION 72
88 5.1 Introduction: This chapter of the research will look at results, as well as showing energy consumption. Results will vary, some with energy savings, and others on the same energy consumption level compared to the baseline set for the study. To comprehend the results, it is essential to understand the base case scenario the study is focused on marked in the first column in Table 5.1. (South Orientation, 5x10 plan depth, number of opening: 1, height of the light shelf 1m, projection of the Exterior shelf 2m, depth of the interior 5m). The study carried out measures the percentage savings by method followed: Percent savings are calculated by: 100 x (studied model baseline model) / baseline model Part of the study will include percent savings, peak hour energy consumption graphs, and daylight flux figures which are able to illustrate light penetration into the space. These figures and graphs give a better understanding of what is actually occurring in each of the office modules. Final studies will looked at a collective outlook of energy consumption in each of the cases, and a combined study of the most ideal parameters that would make the most reduced energy consumption result. 5.2 Study for orientation The study will look at testing the same constant parameters except for changing model orientation. South, East, and West orientations are going to be looked at and analysed shown in Table 5.1. Table 5.1 Orientation parameters Orientation Plan depth Number of LS height Exterior Interior openings South 5x10m 1 1m 2m 5m East 5x10m 1 1m 2m 5m West 5x10m 1 1m 2m 5m Table 5.1 presents baseline energy consumption values for the study. It consists of the data that the analysis is going to be compared to. The baseline in this study is an office without lightshelves. To be able to examine the difference in energy consumption, as well as the addition of the dimming of lights it is important to consider these figures. Since chillers are 73
89 mostly used throughout the UAE due to the hot and humid climate, it consumes large energy demands that should be looked at. Lights are the focus of the study, which means looking at both chillers and lights energy in the model will demonstrate the total energy consumed in the office. Table 5.2 will show the baseline for the orientations, as well as Table 5.3 presenting the results of the study for orientation. Table 5.2 Baseline for orientation Baseline Chillers (MWh) Lights (MWh) Total Energy (MWh) South East West Results for (SEW, 2Ext, 5In, 1 H) *1 opening Orientation: South, East, West Plan size: 5x10m Exterior Light shelf projection: 2 meters Interior Light shelf depth: 5 meters Height depth: 1 meter Openings: 1 opening Orientation Chillers (MWh) Lights energy (MWh) Total Energy (MWh) LS LS / LS LS opening/ opening opening/ LS /opening opening/no LS /opening/ no DIM with DIM no DIM Dim DIM with Dim South % savings -19.2% -21.7% 0% -26.0% -15.0% -22.6% East % savings -16.1% -18.6% 0% -25.2% -12.5% -20.1% West % savings -15.4% -18.4% 0% -30.2% -12.0% -21.1% Table 5.3 Study for Orientation 74
90 Power (kw) In Table 5.3 three different orientations with and without dimming profiles are compared to their respective baselines shown in table 5.2. When the dimming profile is switched off there is no reduction in the lights energy as shown in in the three different cases of south east and west. The chillers energy savings are the greatest in the southern orientation when the daylighting dimming is switched off and when dimming is switched on. However the west façade demonstrated higher reductions in lights energy. This is due to the increased daylight on the western façade creating heat and resulting in more reductions. In the eastern exposure when the solar gain is maximum, it s early in the morning and the office is not fully occupied. The western façade has greatest energy when daylight dimming is switched off, the office is fully occupied and it all adds up to the peak cooling load. Figure 5.1 shows the peak hour energy consumption, which is mostly around 8:30 am August 12. Figure 5.2 demonstrates Flux DL daylight penetration into the space of the office modules. The Southern façade has more reductions in light and chillers energy with the daylight dimming sensors on. This also reflects to the total energy savings which is around 22.6%. A 20% reduction in total energy that was achieved in the South façade, while the east façade showed 20.1% reductions :00 06:00 12:00 18:00 00:00 Date: Thu 12/Aug Chillers energy: (5x10 dim with ls newest.aps) Total lights energy: (5x10 dim with ls newest.aps) Chillers energy: (5x10 no dim with ls newest.aps) Total lights energy: (5x10 no dim with ls newest.aps) Figure 5.1 South façade Peak hour at Aug/12 Figure 5.1 shows the South façade energy consumption peak hour at 8.30 am Aug/13. The graph shows corresponding results to the percent reductions displayed in Table 5.3. The 75
91 graph displays the chillers energy as well as total lights energy in kw. The chillers energy in red shows highest in energy consumption reaching up to 3.4 kw. This is due to the heat in a city of Dubai where cooling is needed. When dimming profile is applied, the Chillers energy reductions in blue show minor reductions in energy. However, when the dimming profile is applied total lights energy marked in blue, reductions reach up 0.3kW. This is due to the light illuminating the space on the south side. Figure 5.2 South façade Light shelf Daylight flux analysis Figure 5.2 shows the South façade which is the base case on the daylight flux analysis. Higher levels of light penetration are shown in the interior space of the office through the opening and window. This also would mean that greater solar heat gain would also access the space from the south orientation. Referring to the daylight (lux) key, colors determine how much lux penetrates into the space. The close to it to the blue the higher the lux level reaches, the more the lighting in the office. The close it is to the red the less the lux levels in the office space. Lighter shades of red, yellow, and green and blue confirm daylight levels reaching more than half of the office space. 76
 Total lights energy: (5x10 east dim ls newest.aps) Chillers energy: (5x10 east dim ls newest.aps) Figure 5.3 East façade Peak hour graph at Aug/12 Figure 5.")
92 Power (kw) :00 06:00 12:00 18:00 00:00 Date: Thu 12/Aug Total lights energy: (5x10 east no dim ls newest.aps) Chillers energy: (5x10 east no dim ls newest.aps) Total lights energy: (5x10 east dim ls newest.aps) Chillers energy: (5x10 east dim ls newest.aps) Figure 5.3 East façade Peak hour graph at Aug/12 Figure 5.3 shows the peak hour graph for the East façade. On the east orientation, chillers energy show high levels of energy being consumed reaching up to 4kW at 8 am.. Even when dimming profile is turned on the reduction is minor. However on the east side lights energy demonstrates a significant amount of reduced energy. From the graph it is show that solar heat gain has made it harder for energy to be reduced. Figure 5.4 East façade Daylight flux analysis Figure 5.4 illustrates the East façade that shows more light penetration coming into the deep part of the space. This also would mean that greater solar heat gain would also access the space. Wherever the opening is located, around it there are more daylight levels. Light levels 77
 Chillers energy: (5x10 west no dim ls new.aps) Total lights energy: (5x10 west dim ls new.")
93 Power (kw) do reach up to more than half the office space, which means the office is almost lit, while the rest of the office remains around 100 lux :00 06:00 12:00 18:00 00:00 Date: Thu 12/Aug Total lights energy: (5x10 west no dim ls new.aps) Chillers energy: (5x10 west no dim ls new.aps) Total lights energy: (5x10 west dim ls new.aps) Chillers energy: (5x10 west dim ls new.aps) Figure 5.5 West façade Peak hour graph at Aug/12 Figure 5.5 shows the west façade energy consumption peak hour at Aug/12 at around 8.30 am. This mostly happens when the working day starts. This graph is parallel to the results in table 5.3; the west façade shows greatest results when compared to the other orientations. Higher reductions in lights energy are shown. This is due to the increased daylight on the western façade creating heat and resulting in more reductions. Figure 5.6 West façade Daylight flux 78
94 Figure 5.6 daylight flux level displays greater light penetration into the office space. The West façade day lux study is corresponding to table 5.3. As seen, lux levels in brighter blue reached up to 500 lux from the openings, window and lightshelves that have been placed. The rest of the office remains approximately at lux which means that the office is almost lit. 5.3 Study of Plan depth: In order to keep the study coherent deep plan depth was chosen. The study selected plans that are shown in Table 5.4. When the plan got deeper in depth, the harder it was for light to penetrate into the space. Therefore three different plan sizes have been tested in order to show light illumination in office spaces. Table 5.4 shows the constant base case, which are the orientation, number of openings, lightshelf height, exterior projection and interior depth. The only variable that is going to be changing is the plan depth. Table 5.4 Plan depth Orientation Plan depth Number of LS height Exterior Interior openings South 5x5m 1 1m 2m 5m South 5x10m 1 1m 2m 5m South 5x15m 1 1m 2m 5m Figures that measure the chillers and lighting energy used in alternate plan sizes are shown in table 5.5. As the south orientation is the base case, it remains unchanged, while only changing the plan of the depth. The figures are calculated without the use of lightshelves, in order to compare results. Table 5.6 will then show results for the study of plan depth. Table 5.5 Baseline for Plan Depth Baseline Chillers (MWh) Lights (MWh) Total Energy (MWh) South 5x5m South 5x10m South 5x15m Results for (S, 2Ext, 5In, 1 H) *1 opening 79
95 Plan size: 5x5m, 5x10m, 5x15m Exterior Lightshelf projection: 2 meters Interior Lightshelf depth: 5 meters Height : 1 meter Openings: 1 opening Table 5.6 Study for the Plan Depth Plan Chillers (MWh) Lights energy (MWh) Total Energy (MWh) South LS with opening/ LS/ opening LS opening/no LS/opening/ Dim LS opening/no LS/opening/ with Dim no DIM with DIM DIM DIM 5x5m % savings -27.2% -30.4% 0.0% -49.6% -22.8% -33.5% 5x10 m % savings -19.2% -21.7% 0% -26.0% -15.0% -22.6% 5x15 m % savings -14.6% -15.3% 0.0% -6.2% -10.9% -13.0% Table 5.6 shows the alternative sizes of deep plan offices examined. Three different sizes were selected for the study in order to find optimal energy savings. Dimensions for the plans are: 5x5m, 5x10m, and 5x15m. Lightshelves were placed on the south side, and dimensions of the lightshelves were based on the base case of the model presented in table 5.4. The lightshelf size for the model 5x5m had to be altered since the base case parameter of the lightshelf is bigger than the plan itself. The size of the lightshelf tested for 5x5m plan is: 2.50m interior depth, and 2m exterior projections. As for the other two plans the dimensions were unchanged. From the calculations provided it is clear that the smaller the plan the more daylight is accessible into the space as seen in the total energy of the 5x5 m plan at -33.5% reductions. However, the chillers energy in the 5x5m plan presents high percentages in reduction without dimming, which is the daylight being the contributing factor that requires on going cooling from the excessive amount of daylighting penetrating the space. When 80
96 Power (kw) dimming is turned on the chillers are to quickly cool the space since it is 5x5 meter is not considered a deeper plan. Lights energy indicates the most beneficial results in the first case, since the space is small and is easily lit by daylighting. Artificial lights will not be working when there is sufficient light. However, lights energy reaches up to 49.6% in the 5x5m case. As for a deeper plan of 5x10m, when dimming is switched off, chillers energy shows a % in reduced energy. Yet when dimming is switched on 5x10m plan shows greatest results of in chillers energy savings. The lightshelves are playing a part as a shading device as well as letting in some light to penetrate into the space. As for the deepest plan 5x15m it is shown to have the lowest chillers energy percentage and lowest in the lights energy reductions. This is due to the deeper space, in which achieved only -6.2% reduction in lighting, due to the electrical lighting that is highly depended on in deeper spaces. The optimal case would 5x10m plan in which is more ideal in terms of both energy saving and covering a bigger space. Even though 5x5m configuration gives us the best and highest energy reduction in the office space realistic usage requirements demand a bigger and deeper space. Therefore, a deeper and more ideal plan is the selection of the 5x10m. As the plan gets deeper, the energy usage intensity increases :00 06:00 12:00 18:00 00:00 Date: Thu 12/Aug Total lights energy: (5x5 depth with dim with ls newest.aps) Chillers energy: (5x5 depth with dim with ls newest.aps) Total lights energy: (5x5 depth no dim with ls newest.aps) Chillers energy: (5x5 depth no dim with ls newest.aps) Figure 5.7 5x5m plan depth Peak hour graph at Aug/12 Figure 5.7 demonstrates 5x5 plan depth hour graph at Aug/12, the graph is parallel to the percent reductions in table 5.6 which shows greatest reductions in energy consumption.due to the smaller space, light easily illuminates the whole area. As demonstrated in the graph, at 81

97 8 am when the office gets occupied energy is being consumed therefore the chillers energy reaches 2 kw. However when the dimming profile is switched on, the office space is easily cooled due to the small space. Similarly, the lights energy is also consumed during working hours in which light quickly illuminates the space and reaches up to 300 lux where the sensors switch off lighting fixtures. Figure 5.8 5x5m Plan Depth Daylight Flux Levels Figure 5.8 represents the daylight flux level for the 5x5 plan depth office. The figure shows the highest amount of daylight penetrating into the spaces from the window and opening compared to all the cases that have been looked at. This is due to the smaller plan depth compared to the other deeper plan cases also creating higher solar heat gain. Lighting levels reach up to 580 lux at the opening of the lightshelf which means that the lightshelf with open helps light illumination into the space. 82
98 Power (kw) :00 06:00 12:00 18:00 00:00 Date: Thu 12/Aug Chillers energy: (5x10 dim with ls newest.aps) Total lights energy: (5x10 dim with ls newest.aps) Chillers energy: (5x10 no dim with ls newest.aps) Total lights energy: (5x10 no dim with ls newest.aps) Figure 5.9 5x10m plan depth Peak hour graph at Aug/12 The graph in figure 5.9 illustrates the energy consumption in a 5x10 m plan office. Most energy consumed is occurring during early hours of the morning when the office building begins to operate. Chillers energy is shown to be highest during the peak hour at around 8:30 am when the working day begins. Figure x10m plan depth Daylight flux levels 83
99 Power (kw) Figure 5.10 shows the daylight flux levels in which the southern facing offices are expected get Daylight. Brighter colors of red and orange show daylight levels ranging up to 460 lux as light penetrates deeper into the space through the lightshelf opening and windows :00 06:00 12:00 18:00 00:00 Date: Thu 12/Aug Total lights energy: (5x15 no dim ls.aps) Chillers energy: (5x15 no dim ls.aps) Total lights energy: (5x15 dim ls.aps) Chillers energy: (5x15 dim ls.aps) Figure x15m peak hour graph at Aug/12 Figure 5.11 shows the energy consumption figures at a deeper plan of 5x15m. The graph verifies that the energy reduction is the least in deeper plans because of the dependency on electrical lighting and chillers energy. The bigger the office plan the more energy is consumed which is why the chillers energy reached up to 5kW at 8 am. Even when the dimming profile is switched on the energy consumption level remains high, due to the massive space that needs to constantly cooled and lit up for the office to be able to function. 84

100 Figure x15m plan depth Daylight flux levels Figure 5.12 illustrates the daylight flux levels, lighting does penetrate into the office the light shelf through the opening and window. However light does not penetrate much deeper into the office due to the longer area. The deeper the office is the harder it is for light to penetrate further. Light levels reach up to 460lux mostly at the openings, and remain around 100 lux in most areas. The dimming profile is not working which makes the office rely on electrical lighting, and therefore consume more energy. 5.4 Study of lightshelf Height In order to understand what parameter affects lighting penetration deeper into the office space it is essential to look at lightshelves placement height. The placement height of the lightshelf may play a major role in light reflection and redirection. Therefore tests have been attempted to show the differences in values. Table 5.7 presents the different lightshelves heights that are assessed. As highlighted in table 5.7, 0.5 meters, 1 meter, 1.5 meter are the dimensions of the lightshelves from the roof. Table 5.8 looks at the baseline for a model without the placement of lightshelves, which is then used for the calculation of percent savings. Table 5.9 will show the results of the study of lightshelf height, as well as the total percentages in energy reduction. 85
101 Table 5.7 Lightshelf Height Orientation Plan depth Number of LS height Exterior Interior openings South 5x10m m 2m 5m South 5x10m 1 1m 2m 5m South 5x10m 1 1.5m 2m 5m Table 5.8 Baseline Baseline Chillers (MWh) Lights (MWh) Total Energy (MWh) No lightshelves Results for (S, 2Ext, 5In) *1 opening Exterior Lightshelf projection: 2 meters Interior Lightshelf depth: 5 meters Height of shelf: 0.5m, 1m, 1.5m Openings: 1 opening Table 5.9 Lightshelf Height LS Height Chillers (MWh) Lights energy (MWh) Total Energy (MWh) South LS with opening/ LS/ opening LS opening/no LS/opening/ Dim LS opening/no LS/opening/ with Dim no DIM with DIM DIM DIM 0.5m % savings -20.0% -23.1% 0% -32.3% -15.6% -25.1% 1m % savings -19.2% -21.7% 0% -26.0% -15.0% -22.6% 1.5m % savings -16.5% -17.0% 0% -5.0% -12.9% -14.4% 86
102 Table 5.9 looks at 3 different lightshelf heights of the following dimensions: 0.5m, 1m, 1.5m. These different heights are compared to the base case as it was done in the previous studies, and then obtaining a percent savings on the energy reduction and total energy. It is indicated that when the dimming profile is switched off, there is no reduction in electricity consumption. When dimming is switched on total energy reduction occurs the most with the highest height which is the 0.5m closer to the roof. The least amount of reduction at 1.5m in height since the total reduction reaches 14.4%. What could be said is that the higher the light shelf height the more it can serve as a shading device, and could stop heat from entering the space. When this happens there is a less need for chillers to be fully switched on. Lightshelves placed at 0.5m in height from the roof shows the least in reduction of lighting energy, which could be that the shelf is fully blocking the sun light in which shifted the dependency onto the electrical lighting to be used. The light shelf works best in terms of reducing the cooling energy and increasing the daylight when it s closer to the roof. Figure m Height of Light shelf peak hour graph at Aug/12 Figure 5.13 shows the first case the light shelf height that has been assessed. The graph presents parallel information to table 5.9 of energy consumption levels. Peak hours are usually around 8:30 am when the building starts to operate. Energy consumption levels reach up to 3.3 kw early in the morning when the office is functioning and decrease throughout the 87

103 Power (kw) day. When the dimming profile is applied, drastic changes in the total lights energy are present due to the daylight availability. Figure height of LS Daylight flux levels Figure 5.14 demonstrates the daylight flux levels, in which lights penetrate into the space, while serving as a shading device. Lightshelves placed at 0.5 height level shows very intense daylight penetration. Light penetration does reach almost to the middle of the office space and does remain constant at 150 to 200 lux level :00 06:00 12:00 18:00 00:00 Date: Thu 12/Aug Chillers energy: (5x10 dim with ls newest.aps) Total lights energy: (5x10 dim with ls newest.aps) Chillers energy: (5x10 no dim with ls newest.aps) Total lights energy: (5x10 no dim with ls newest.aps) Figure m Height of Light shelf peak hour graph at Aug/12 88
104 Figure 5.15 shows the peak hour graph for 1 m height of the light shelf. Results of the study demonstrate that Aug/12 at 8:30 with the greatest solar heat gain, which shows most energy consumption levels. Chillers energy in the graph reach up to 3.3 kw, while this amount gets reduced throughout the office hours. Slight changes occur when the dimming profile is switched on, yet it is mostly effective with lights energy level. This is because enough daylighting is accessing the space and lighting the office area, which reduces the dependency on artificial lighting. Figure m height of LS Daylight flux Figure 5.16 shows daylight flux levels for 1m height of lightshelves. Results demonstrate less light penetration into the space when compared to the other cases. However, daylight levels reach up to 460 lux at the opening of the lightshelf. 89
105 Figure m Height of Light shelf peak hour graph at Aug/12 Figure 5.17 shows the peak hour graph which is also at Aug/12 at around 8:30 demonstrated in the study. The Results of the graph are parallel with the table 5.9 where energy reductions are the least when compared to other light shelf heights. Chillers energy reach up to 3.3 kw, and even when the dimming profile is switched there is no reduced consumption level. Even when looking at the total lights energy, the 1.5 shelf height is certainly serving blocking the sun from illuminating the same, as well as serving as a shading device. 90

106 Figure m Height Daylight flux analysis Figure 5.18 shows daylight penetrating into the space, and happening most through the lightshelf opening and window. However, it was understood that the lower the lightshelf from the ground more it is serving as a shading device, while blocking the sun. The figure shows the least lux levels in the interior space when compared to other lightshelf height scenarios. 5.5 Study of Number of Openings in the Lightshelf It was understood from previous cases that openings made in the lightshelves have the ability to penetrate light into the space, while bouncing the rest of the light further. This section of the study looks at the placement of openings within the lightshelves. The scenarios goings to be looked at are a total of 3 openings 2 openings, and 1 opening which is the base case scenario presented in table Results obtained are presented in table 5.12, and then compared to the baseline shown in table Table 5.10 Number of Openings Orientation Plan depth Number of LS height Exterior Interior openings South 5x10m 1 1m 2m 5m South 5x10m 2 1m 2m South 5x10m 3 1m 2m 5m 91
107 Table 5.11 Baseline of No Lightshelves Baseline Chillers (MWh) Lights (MWh) Total Energy (MWh) No lightshelves Results for (SEW, 2Ext, 5In, 1 H) *1 opening Exterior Lightshelf projection: 2 meters Interior Lightshelf depth: 5 meters Height of light shelf: 1 meter Openings: 1 opening, 2 openings, 3 openings Table 5.12 Study of Lightshelf Openings Number of opening Chillers (MWh) Lights energy (MWh) Total Energy (MWh) South LS with opening/n LS/ opening LS opening/no LS/opening/ Dim LS opening/no LS/opening/ with Dim o DIM with DIM DIM DIM % savings -19.2% -21.7% 0% -26.0% -15.0% -22.6% % savings -19.1% -21.6% 0% -26.0% -14.9% -22.6% % savings -19.1% -21.6% 0.0% -26.0% -14.9% -22.5% % savings -19.2% -21.3% 0.0% -21.7% -15.0% -21.4% Table 5.12 shows three different lightshelves; each lightshelf consists of either 1 opening, 2 openings or 3 openings or a case without any openings. Since the openings are 92
108 Power (kw) placed inside the lightshelf, it does not contribute to the shading which is shown in the first column. When a lightshelf is placed, but without an opening it serves more as a shading device, this is because an opening can let some daylight into the space. However when 2 openings are placed, light energy savings increased to 26%. The percent savings for the chillers ranges from 21.6% to 21.7% when dimming profile is switched on, this can be due to the lightshelf blocking the heat. The total energy percent savings show similar reductions in most scenarios, however the placement of two or three openings show 22.6 and 22.7%. To understand this study one should recognize that the more the openings in the lightshelf the more the daylight can come into the space, while serving as a shading device at the same time. Overall, between 1, 2 and 3 opening no significant change in energy consumption is observed. Therefore, this analysis is likely not sensitive enough for studying the number of openings on the lightshelf :00 06:00 12:00 18:00 00:00 Date: Thu 12/Aug Chillers energy: (5x10 dim with ls newest.aps) Total lights energy: (5x10 dim with ls newest.aps) Chillers energy: (5x10 no dim with ls newest.aps) Total lights energy: (5x10 no dim with ls newest.aps) Figure opening in the Lightshelf peak hour graph at Aug/12 Figure 5.19 illustrates the energy consumption peak hour which is in Aug/12 around 8:30 am. The graph energy reduction is parallel to the results in table 5.12, which is the base case with one lightshelf and one opening placed. Reductions occur mostly in the total lights energy, while chillers energy remain high even with dimming profile being switched on. 93
109 Power (kw) Figure opening in lightshelf Daylight flux analysis Figure 5.20 shows light penetration deeper into the space through the placement of one opening in the lightshelf. With this module being the base case, light levels reach up to 460 lux shown in shades of blue, while reaching 280 lux even after the lightshelf. This module shows that the placement of lightshelf with an opening makes a difference in the results :00 06:00 12:00 18:00 00:00 Date: Thu 12/Aug Total lights energy: (5x10 no dim with ls newest 2 openings.aps) Total lights energy: (5x10 dim with ls newest 2 openings.aps) Chillers energy: (5x10 no dim with ls newest 2 openings.aps) Chillers energy: (5x10 dim with ls newest 2 openings.aps) Figure openings placed on the Lightshelf peak hour graph at Aug/12 94

110 We can see that findings of the annual analysis reaffirm the findings of the data in table Peak hour remains at 8:30 am when the building starts to operate. What was understand that after the placement of two openings, still light and heat would penetrate into the office space, even with the dimming profile being switched on chillers energy still remained high to be able to cool the space. Total lights energy did decrease but the total energy reduction level was not very high. Figure openings in the Lightshelf Daylight flux analysis 5.22 illustrate that the more the openings placed in the lightshelf the more light can penetrate into the space. Daylight levels show similar ranges to 1 opening at 460lux. As mentioned, that the more the opening the more the light and heat the is accessible to the space. The more the chillers energy has to be consumed to be able to cool the office space. Light levels do reach into the space with double the amount of openings than the base case. 95
 Chillers energy: (5x10 dim with ls newest 3 openings.aps) Total lights energy: (5x10 no dim with ls newest 3 openings.aps) Total lights energy: (5x10 dim with ls newest 3 openings.aps) Figure 5.")
111 Power (kw) :00 06:00 12:00 18:00 00:00 Date: Thu 12/Aug Chillers energy: (5x10 no dim with ls newest 3 openings.aps) Chillers energy: (5x10 dim with ls newest 3 openings.aps) Total lights energy: (5x10 no dim with ls newest 3 openings.aps) Total lights energy: (5x10 dim with ls newest 3 openings.aps) Figure openings in the Lightshelf peak hour graph at Aug/12 Figure 5.23 reaffirms the findings and data obtained in table When three different openings are placed on the lightshelf, light and heat still are entering the space, while chillers energy level is greater than lights energy therefore the total energy becomes high compared to the rest of the lightshelf opening scenarios. Lights energy shows improvement when the dimming profile is switched on, although it doesn t completely affect the total energy reduced Figure openings in the Lightshelf Daylight flux levels analysis 96
112 Figure 5.24 demonstrates similar results as the previous daylight flux levels, whereas the openings help daylight penetration into the space. With three openings placed on the lightshelf, more light illuminates the space. 460 lux levels are shown closer to the window, which is considered bright and may produce a lot of glare, and disrupt the occupants. Light levels do remain constant at around 100 lux. 5.6 Study of Lightshelf Exterior projection There is a difference between the interior and the exterior projection of the lightshelves. The exterior projection is the focus of this segment of the study. It is the projection that extends outward, and the first interaction between the sun light and the light shelf. From previous studies it was understood that difference in exterior projections may alter results. Table 5.13 offers the three lightshelve heights examined marked in red. Table 5.14 shows the baseline case with no lightshelves to be able to compare results obtained in table Table 5.13: Exterior projection Orientation Plan depth Number of LS height Exterior Interior openings South 5x10m 1 1m 0.5 5m South 5x10m 2 1m 1m 5m South 5x10m 3 1m 2m 5m Table 5.14: Baseline for No lightshelves Baseline Chillers (MWh) Lights (MWh) Total Energy (MWh) No lightshelves Results for (S, 2Ext, 5In, 1 H) *1 opening Exterior Lightshelf projection: 0.5m, 1m, 2m Interior lightshelf depth: 5m Height of lightshelf: 1m Openings: 1 opening Table 5.15: Study of Exterior projection 97
113 Light shelf Exterior projection Chillers (MWh) Lights energy (MWh) Total Energy (MWh) South LS with opening LS/ opening LS opening/no LS/opening/ Dim LS opening/no LS/opening/ with Dim /no DIM with DIM DIM DIM 0.5m % savings -9.8% -12.8% 0.0% -31.9% -7.6% -17.0% 1 m % savings -13.9% -16.9% 0.0% -31.3% -10.8% -20.0% 2m % savings -19.2% -21.7% 0% -26.0% -15.0% -22.6% Table 5.15 demonstrates the different lightshelf exterior projections extended outward. Three different exterior lightshelves were looked at: 0.5m, 1m, and 2m. Table 5.15 shows that the more the lightshelves extend outward the more it creates a shading effect. This mostly shows in the chillers energy percentage rate with an outward depth of 1m and 2 m. Lights energy seems to be the most consuming of energy in the 2meter exterior projection since the light shelf was serving as a shading device, although the total energy reduction is most ideal at 2 m extension. This is because chillers energy consumption is greater than the lights overall. When shading happens, there is a need for depending on artificial lights. However, there is less heat entering the space due to the shading effect from the light shelf in which less air-conditioning is necessary which is shown to be the greatest energy saving at 2 m exterior projection. 98
114 Figure m Exterior projection of Lightshelf peak hour graph at Aug/12 Figure 5.25 reaffirms the data obtained in table Where high electricity demands occur during early in the morning when the building starts to operate. The 0.5 m exterior projection shows the least in reduction on chillers energy. This is due to high solar heat gain that penetrates into the space. However when the dimming profile is switched on, total lights energy is saving up to 30% because light is entering the space and reaching up to 300 lux, and then would reduce the dependency on electrical fixtures. Figure m Exterior projection of Lightshelf Daylight flux analysis 99
115 Power (kw) Figure 5.26 illustrates the light penetration into the space when the lightshelf outward depth extends at 0.5 m. Higher levels of light reach up to 900 flux causing more heat gain to the space. This module makes it clear why the chillers energy was high, this is because there is plenty of light, yet at the same time chillers need to be constantly cooling the exposed space :00 06:00 12:00 18:00 00:00 Date: Thu 12/Aug Total lights energy: (5x10 no dim with ls 1 exterior proj.aps) Total lights energy: (5x10 dim with ls 1 exterior proj.aps) Chillers energy: (5x10 no dim with ls 1 exterior proj.aps) Chillers energy: (5x10 dim with ls 1 exterior proj.aps) Figure m Exterior projection of Lightshelf peak hour graph at Aug/12 Figure 5.27 demonstrates a 1 m exterior projection of the lightshelf at 8:30 am, where energy is most consumed. 1m exterior depth allows daylight into the space, allowing the dimming of artificial lighting to occur. 100

116 Power (kw) Figure m Exterior projection of Lightshelf Daylight flux analysis Daylight flux levels in figure 5.28 demonstrate more light entering the space than other exterior projection studies. Lux levels range up to 950 lux, however do not penetrate deeper into the space. The daylight flux levele remain constant at around 100 lux in the interior of the office :00 06:00 12:00 18:00 00:00 Date: Thu 12/Aug Chillers energy: (5x10 dim with ls newest.aps) Total lights energy: (5x10 dim with ls newest.aps) Chillers energy: (5x10 no dim with ls newest.aps) Total lights energy: (5x10 no dim with ls newest.aps) Figure m Exterior projection of Lightshelf peak hour graph at Aug/12 101
117 Figure 5.29 reaffirms the study in table Energy consumption peak hour happens at around 8:30 am in Aug/12. Chillers energy reaches up to 3.3 kw which is considered high compared to the rest of the exterior projection scenarios. However, the 2 meter projection serves a great advantage to the office, in which it serves as shading device and at the same time reflects light deeper into the space. Figure 5.30 illustrates daylight penetration into the space, and confirms the results obtained in table Light levels reach up to 900lux causing solar heat gain. When solar heat gain occurs chillers energy is more consumed. The module shows more light reflecting into the space where light reaches more than half the office which is because of the lightshelf projection. Figure m Exterior projection of Lightshelf Daylight flux analysis 5.7 Study of Lightshelf Interior depth After assessing the exterior projection of the lightshelves, it is crucial to look at the interior depth. The interior depth of the lightshelf is the part that extends inward, towards the interior of the space. It was understood from previous studies that the interior depth of the lightshelves may alter the light reflection and redirection into the space. Therefore a table 5.16 shows the different light shelf depths examined. Table 5.17 shows the baseline of the study with a module without lightshelves to compare results obtained. Results obtained are presented in Table
118 Table 5.16: Study of Interior Depth Orientation Plan depth Number of LS height Exterior Interior openings South 5x10m 1 1m 2m 2.5m South 5x10m 2 1m 2m 5m South 5x10m 3 1m 2m 7.5m Table 5.17: Baseline for No Lightshelves Baseline Chillers (MWh) Lights (MWh) Total Energy (MWh) No lightshelves Results for (S, 2Ext, 5In, 1 H) *1 opening Exterior Lightshelf projection: 2m Interior Lightshelf depth: 2.5m, 5m, 7.5m Height of lightshelf: 1m Openings: 1 opening Table 5.18: Interior Depth of Lightshelf Light shelf Interior Depth Chillers (MWh) Lights energy (MWh) Total Energy (MWh) South LS with opening/ LS/ opening LS opening/no LS/opening/ Dim LS opening/no LS/opening/ with Dim no DIM with DIM DIM DIM 2.5m % savings -18.8% -21.3% 0.0% -26.4% -14.6% -22.4% 5m % savings -19.2% -21.7% 0% -26.0% -15.0% -22.6% 7.5m
119 % savings -18.9% -21.5% 0.0% -26.6% -14.7% -22.6% Table 5.18 looks at various inward depths of the lightshelves. Three dimensions were looked at: 2.5, 5m and 7.5. The 7.5 m interior depth preforms better in which it can be said that this happens due to the deeper penetration to the space through reflectance. When the dimming profile is switched off the 2.5 meter shows the least in energy reduction. This could be that the sun is penetrating into the space, and creating heat. When dimming is switched on better reduction rates occur in the 5 meter depth and 7 meter depth and higher reduction rates ranging from 22.4% to 22.6% for both 7.5m and 5m depth. As for the lights energy, when the dimming is switched off it is constantly at 0% reduction, but when dimming is switched on the optimal case would 7.5meters depth. This is because of the total energy reduction of 22.6% which is the highest amongst the other interior depths. What could be is that the 7.5m case has the most shading, and most reflectance into the space, therefore results in the optimum energy savings. Figure m Interior depth of Lightshelf peak hour graph at Aug/12 Figure 5.31 reaffirms that the least energy consumption occurs at 2.5 depth of lightshelf due to solar heat gain. However daylight reduction occur when the dimming profile is switched on. 104
120 Power (kw) Figure Interior depth of Lightshelf Daylight flux analysis Figure 3.32 illustrates the results obtained in table 5.17, where more light is penetrating into the space when the lightshelf is extending inwards at 2.5m depth. The lightshelf seems to act as a shading device hence blocking the sun and at the same time reflecting light deeper into the space :00 06:00 12:00 18:00 00:00 Date: Thu 12/Aug Chillers energy: (5x10 dim with ls newest.aps) Total lights energy: (5x10 dim with ls newest.aps) Chillers energy: (5x10 no dim with ls newest.aps) Total lights energy: (5x10 no dim with ls newest.aps) Figure m Interior depth of Lightshelf 105 Peak hour graph at Aug/12
121 Figure 5.33 confirms the the results obtained, and that energy consumption higher than 2.5m interior depth due to the light shelf serving as a shading device and therfore blocking solar heat gain. Figure m Interior depth of Lightshelf Daylight flux analysis Figure 5.34 shows daylight penetration into the space, as well as the lightshelf serving a shading device. Daylight reaches 900 lux through the window and lightshelf opening. Which could cause glare disturbances closer to the window. 106
122 - Figure m Interior depth of Lightshelf peak hour at Aug/12 Figure 5.35 shows the peak hour in Aug/12 happening around 8:30 am. The graph reaffirms the results obtained in table Figure m Interior depth of Lightshelf Daylight flux analysis 107
123 Figure 5.36 confirms that the 7.5 meter inward depth is an ideal case, since light is penetrating into the space, as well as blocking solar heat gain. This module shows most light penetration into the space when compared to the rest of the interior depth of the lightshelves. It was understood that the lightshelves both serve as a shading device that blocks the sun, and at the same time the reflectance level of the lightshelf helps the light illuminate the space further. The graphs and figures reconfirm the results obtained from each study and case looked at. IES-VE calculations show that peak day and hour happen in every case during Aug/12 at around 8:30am. It is important to understand the connection between daylight flux levels, and the energy consumption graphs. If the figures show difference this means the study is done incorrectly. Correct studies should be parallel to the percentages obtained and therefore could be validated. 5.8 Optimal Configuration Analysis A combined study was tailored according to the greatest energy reductions and daylight penetration into the space. This study selected parameters from the cases analysed and was inputted into one office module. To further understand each study, it is important to consider that different parameters have been examined, and according to the most ideal case was to be chosen. The parameters selected for the combined study are: Orientation: South Plan depth: 5x10m Lightshelf height: 0.5m from the roof Number of openings: 2 Exterior projection: 2m Interior depth: 7.5m All of the parameters were then calculated and compared to the base case which is a 5x10 South orientation excluding dimming profile and Lightshelves. This was attempted to be able to understand the difference in results, as well as the reduction in energy and light penetration. Table 5.20 demonstrates the study that was examined as well as showing the percent savings compared to the base case presented in table
124 Table 5.19: Baseline Baseline Chillers (MWh) Lights (MWh) Total Energy (MWh) South Table 5.20: Combined study Combine d Study South Combine d % savings Chillers (MWh) Lights energy (MWh) Total Energy (MWh) LS/ LS with LS LS openin LS/opening/ opening/n opening/no opening/n g with Dim o DIM DIM o DIM DIM LS opening/dim % -22.8% 0.0% -30.5% -15.5% -24.5% From table 5.20 the maximum reduction in energy is obtained through selecting the most ideal parameters. The south façade has demonstrated great potential for reduction of chillers energy in the previous studies. Chillers energy reaches up to 22.8% when dimming profiles are switched on. The lightshelf is simply serving as a shading device, in order to let some light in, without heat gain. Lights energy show a major reduction at 30.5%, which means that the two openings were placed in a very beneficial way to the interior of the space. Lighting in the office module is purely penetrating into the space through reflection as well as through the two openings added. The total energy consumption is equal to 24.5% which shows the highest and most ideal when compared to previous studies. 109
125 Power (kw) :00 06:00 12:00 18:00 00:00 Date: Thu 12/Aug Chillers energy: (combined study no dim.aps) Total lights energy: (combined study no dim.aps) Chillers energy: (combined study dim.aps) Total lights energy: (combined study dim.aps) Figure 5.37 Combined study peak hour graph at Aug/12 Figure 5.37 shows results for the combined study, the early morning hours of the graph indicate that when the building is not under direct solar load from the glazing. What could be understood from this graph is that each kw of reduction in light energy saves a kw in cooling energy. Table 5.21 shows the average reduction in chillers energy per each kw saved from dimming profiles in lighting energy. 110
 energy (kw) Energy (kw) (kw) (kw) energy (kw) Lights")
126 Table 5.21: Calculation of Average Reduction in Chillers Energy per each kw Savings in Lighting Energy. Total lights Total lights Reduction in Lights Chillers energy Chillers energy Reduction in chillers Chillers energy vs Average Ratio energy (kw) energy (kw) Energy (kw) (kw) (kw) energy (kw) Lights energy reduction ratio A B C=A-B D E F=D-E G=F/C AVG(G) South Base Combined Base South Base combined Dim Time 08: : : Figure 5.38 Combined study Daylight flux analysis 111
127 Figure 5.38 shows the combined study daylight flux analysis. Flux levels reach up 1050 when placing two openings, while remaining constant at 250 lux in the rest of the office space. Total energy consumed is less due to the lightshelf serving as a shading device and therefore lowering the amount of chillers energy needed. Figure 5.39: Overall Combined Energy Analysis Graph Figure 5.39 offers a deeper understanding of the energy reductions throughout the whole research paper. It also demonstrates each case breakdown and then compared to the baseline it was associated with. Cooling energy is marked with a blue color, and lights energy with a yellow color, as well as the percent savings shown in green. Baseline modules are marked with darker shades of blue and orange. Baseline cases are marked with darker shades of orange and navy blue, while regular parameters are marked with lighter yellow and lighter blue. Each case is placed close to its baseline in order to easily compare scenarios. The green squares show the percent savings obtained from each case. As shown in figure 5.39, the combined study demonstrates the highest in the total energy reductions compared to all the cases of the research. This is because of the ideal parameters selected and tailored the study to maximize energy reductions. 112


128 Combined Daylight flux analysis for all cases: South East West 5x5m Plan 5x10m Plan 5x15m Plan 113


129 0.5m H of Lightshelf 1m H of Lightshelf 1.5m H of Lightshelf 1 Opening 2 Openings 3 Openings 114


130 0.5m Ext Projection 1m Ext Projection 2m Ext Projection 2.5m Int Depth 5m Int Depth 7.5m Int Depth 115


131 Combined Optimum Energy Study Combined Maximum Daylighting Study Figure 5.40 Combined Study of All Daylight flux Analysis Figure 5.40 illustrates a combined study of the daylight flux analysis simply shows all the cases that have been tested and examined. It helps with comparing and contrasting between all modules that were looked at. To further expand the study, daylight flux levels have been tested for two different combined daylight flux analysis. The first combined study examined the optimum energy reduced; while the second combined flux study looked at maximum daylight penetration. What could be understood is that without energy conservation daylight is maximized in the office module reaching around 2400 lux -100 lux in most spaces. However, when selecting parameters that improve energy reduction lux levels reach up to lux in most areas. 116
ABU DHABI EDUCATION COUNCIL Abu Dhabi Education Zone AL Mountaha Secondary School g-12 science section Mathematics Student Name:.. Section: How Long i
 ABU DHABI EDUCATION COUNCIL Abu Dhabi Education Zone AL Mountaha Secondary School g-12 science section Mathematics Student Name:.. Section: How Long is the Average Chord of a Circle?/ 2009-2010 Second
R.A.K Chamber of Commerce & Industry Studies & Commercial Cooperation Directorate Economic Studies Section 5510 /50/11 غرفة تجارة وصناعة رأس الخيمة إد
 5510 /50/11 أداء شركات رأس الخيمة المساهمة بسوق أبوظبي لألوراق المالية لعام 4102 بلغ عدد شركات رأس الخيمة المدرجة في سوق أبوظبي لألوراق المالية 11 شركة مساهمة من أصل 87 شركة مساهمة في السوق لعام 5512 حيث
افتتاحية العدد
 موقف جامعة الدولة العربية من عملية السالم املصرية اإلسرائيلية - 791 حوليات آداب عني مشس - اجمللد 97 )يناير مارس 77( ثريا حامد الدمنهوري The Reaction of the League of Arab States towards the Egyptian-Israeli
افتتاحية العدد
 99 حوليات آداب عني مشس اجمللد 93 )يناير مارس 1122( مجال حممد مقابلة A Study of the Term Al Rawnak in Ancient Arab Criticism Gamal Mohamed Mokabla Abstract This paper aims to study the term Al Rawnak, a
R.A.K Chamber of Commerce & Industry Studies & Commercial Cooperation Directorate Economic Studies Section 0802 /80/80 غرفة تجارة وصناعة رأس الخيمة إد
 0802 /80/80 أداء شركات رأس الخيمة المساهمة بسوق أبوظبي لألوراق المالية لعام 5102 بلغ عدد شركات رأس الخيمة المدرجة في سوق أبوظبي لألوراق المالية 01 شركة مساهمة من أصل 77 شركة مساهمة في السوق لعام 0802 حيث
Certified Facility Management Professional WHO SHOULD ATTEND? As a Certified Facility Management Professional course, Muhtarif is the ideal next step
 Certified Facility Management Professional WHO SHOULD ATTEND? As a Certified Facility Management Professional course, Muhtarif is the ideal next step for all those who have completed the Ta aseesy Foundation
Slide 1
 Correlation and Regression اإلرتباط واإلنحدار Correlation اإلرتباط - Describes the relationship between two (X & Y) variables يوضح العالقة بين متغيرين )Y, X( - One variable is called independent (X) and
جامعة جدارا Jadara University كلية: الدراسات التربوية
 Jadara University جامعة جدا ار College: Educational Studies كمية: الد ارسات التربوية اثر حجم العينة وأسموب اختيارها في الخصائص السيكومترية لممقاييس النفسية The Effect Of Sample Size And It's Selection
RAK Chamber of Commerce & Industry Studies & Information Directorate غرفة تجارة وصناعة رأس الخيمة إدارة الدراسات والمعلومات 1122/21/21 مليار درهم حجم
 1122/21/21 مليار درهم حجم تجارة دولة اإلمارات مع الدول العربية حققت التجارة اإلجمالية للدولة مع بقية الدول العربية زيادة سنوية مقدارها %2 تقريبا حيث شكلت الواردات الجزء األكبر من هذه التجارة وتبقى الزيادة
Template for Program Curriculum Structure
 ACADEMIC PROGRAM CURRICULUM STRUCTURE FORM خطة البرنامج األكاديمي Submitted by مقدم من Education كلية التربية Psychological Sciences/ Educational Sciences Name of Department / Academic Unit THE ACADEMIC
افتتاحية العدد
 العمليات العسكرية لدول احللفاء واحملور فوق األرض الليبية 539 5 حوليات آداب عني مشس - اجمللد 4 )إبريل يونيه 24( أدريس عبدالصادق رحيل حممود Military Operations OF Allied and Axis Countries on the Libyan
األستاذ عمر صمادي/ ماجستير لغة انجليزية عمان // Guided writing الكتابة الموجهة * هناك العديد من نماذج الكتابة الموجهه و سنلخصها هنا و يجب ع
 Guided writing الكتابة الموجهة * هناك العديد من نماذج الكتابة الموجهه و سنلخصها هنا و يجب على الطالب ان يتبع الخطوات التي و ذلك حسب العنوان حتى نحصل على العالمة كاملة باذن هللا. How to communicate effectively
جملة ميالف للبحوث والدراسات ISSN : اجمللد 1 العدد / 5 جوان 3152 Mila Univ center. Publish. Co. Environmental Issues and Major Powers. belgac
 جملة ميالف للبحوث والدراسات ISSN : 3223-1235 اجمللد 1 العدد / 5 جوان 3152 Mila Univ center. Publish. Co. Environmental Issues and Major Powers. belgacemi.mouloud@yahoo.com shahinazsbi@yahoo.fr Abstract:
Oligopoly
 OLIGOPOLY JUC مالحظة : الملخص جهد شخصي الجامعة غير مسؤلة عنه, المدونة : https://somenote8.wordpress.com/ احتكار القله OLIGOPOLY بين االحتكار والمنافسة الكاملة BETWEEN MONOPOLY AND PERFECT COMPETITION
Microsoft Word EA-ECCM 2.doc
 ال نامج الزم والما للم وع الت لفة والتقدير واعداد ال م ان ة معتمد عالم ا 18-22 March 2018 Kuwait Introduction This 5-day workshop provides the construction professional with a detailed understanding of
د. ط در ءة ز ا ت ا دزة (درا ا ا ت) د. ط در را ر ا م م ا ا ا : ا ت ا ا ا م وا ا ي و إ ى ا ت ا ا ا دو إ و دة ا و أ اد ا. و ف ا ا إ وا ا ت ا دزة م ا أ ا
 د. ط در را ر ا م م ا ا ا : ا ت ا ا ا م وا ا ي و إ ى ا ت ا ا ا دو إ و دة ا و أ اد ا. و ف ا ا إ وا ا ت ا دزة م ا أ ا") ءة ز ا ت ا دزة (درا ا ا ت) را ر ا م م ا ا ا : ا ت ا ا ا م وا ا ي و إ ى ا ت ا ا ا دو إ و دة ا و أ اد ا. و ف ا ا إ وا ا ت ا دزة م ا أ ا و ت وا ت ا دة أ ا ذ ا ا وا اءات ا ور ا و ن ا ءة و ا م ت ا. ا ا : ا
ءة ز ا ت ا دزة (درا ا ا ت) را ر ا م م ا ا ا : ا ت ا ا ا م وا ا ي و إ ى ا ت ا ا ا دو إ و دة ا و أ اد ا. و ف ا ا إ وا ا ت ا دزة م ا أ ا و ت وا ت ا دة أ ا ذ ا ا وا اءات ا ور ا و ن ا ءة و ا م ت ا. ا ا : ا
Schedule Planner User Guide Target Audience: Students This tool can help you better plan your course schedule by generating a visual representation of
 Schedule Planner User Guide Target Audience: Students This tool can help you better plan your course schedule by generating a visual representation of possible schedules with no time conflict. Getting
خطـــــة المركــــــز التدريبيـــــة خلال شهر كانون ثاني من عام 2004
 10 / 10 / 1 2 6/20 0 6 FRM-TC-T-01-01 تموز )7( التقييم العقاري Real Estate Appraisal 19/08/2019 /07/2019 Project Management - PMP Course 22/08/2019 31/07/2019 تصميم الشآت الخرسانية Concrete Structure Design
AlZuhour Private School مدرسة الزهور الخاصة Term 1 Plan Subject Arabic Grade 2 Term 1 Contents ( كتاب الطالب ) الوحدة األولى :) صح تك بين يد
 الوحدة األولى :) صح تك بين يد") Term 1 Plan 2018-2019 Subject Arabic Grade 2 Term 1 Contents ( كتاب الطالب ) الوحدة األولى :) صح تك بين يديك( -- قصة مسعودة السلحفاة النص املعلوماتي : السلحفاة )الربط: بالعلوم( - النحو والكتابة : -االسم
Term 1 Plan 2018-2019 Subject Arabic Grade 2 Term 1 Contents ( كتاب الطالب ) الوحدة األولى :) صح تك بين يديك( -- قصة مسعودة السلحفاة النص املعلوماتي : السلحفاة )الربط: بالعلوم( - النحو والكتابة : -االسم
Lebanon role of parliament in protecting Litani River from pollution
 ندوة إقليمية للبرلمانيين حول تنفيذ خطة التنمية المستدامة لعام 2030 في المنطقة العربية - 9 تشرين الثاني/نوفمبر 2017 8 بيروت الجمهورية اللبنانية International Parliamentary Conference on Sustainability,
دور ا ا ا ا ى ا ب ا رس ا ر م د إ ا أ أ در ن ا - ا دان ا ذ ا ا ر أ ا
 دور ا ا ا ا ى ا ب ا رس ا ر م د إ ا أ أ در ن ا - ا دان ا ذ ا ا ر أ ا (١٧٠)... دور ا ا ا ا ى ا ب دور ا ا ا ا ى ا ب...( ١٧١ ) دور ا ا ا ا ى ا ب ا رس ا ر م د إ ا أ ا ذ ا ا ر أ ا أ در ن ا - ا دان ا ا ول ا اءات
دائرة اللغة العربية المادة المطلوبة المتحان اإلعادة للعام الدراسي : الصف: الثامن المهارة )الفهم واالستيعاب + التحليل األدبي( النحو المادة ال
الفهم واالستيعاب + التحليل األدبي( النحو المادة ال") دائرة اللغة العربية المادة المطلوبة المتحان اإلعادة للعام الدراسي : الصف: الثامن 2018-2017 المهارة )الفهم واالستيعاب + التحليل األدبي( النحو المادة المطلوبة القراءة: درس احترام النظام )الجزء األول(+ درس
دائرة اللغة العربية المادة المطلوبة المتحان اإلعادة للعام الدراسي : الصف: الثامن 2018-2017 المهارة )الفهم واالستيعاب + التحليل األدبي( النحو المادة المطلوبة القراءة: درس احترام النظام )الجزء األول(+ درس
PowerPoint Presentation
 Al Ain Municipality Investment Projects Select a language ENGLISH Al Ain Municipality Investment Projects Select a project The Asharej Walk Car Showroom & Automall Fashion District Community Centre LANGUAGE
Received: Jan 2018 Accepted: Fèv 2018 Published: Mar 2018 : Abstract: This study ai
 . 1 zoudaammar@yahoo.fr. hamzabkf@yahoo.fr Received: Jan 2018 Accepted: Fèv 2018 Published: Mar 2018 : Abstract: This study aims to investigate on the reality of the securities market in Algeria through
السادة وگاالت اإلعالن والعمالء احملترمني املوضوع اسعار اإلعالنات لعام ابتداء من ابريل Subject Rate card 2015 starting from April تهديگم شرگة ال
 السادة وگاالت اإلعالن والعمالء احملترمني املوضوع اسعار اإلعالنات لعام 20 ابتداء من ابريل Subject Rate card 20 starting from April تهديگم شرگة الراي العالمية للدعاية واإلعالن اطيب التحيات ونشگرگم على دعمگم
افتتاحية العدد
 أطر املعاجلة االعالمية لسياسات الرئيس االمريكى باراك اوباما دراسة مقارنة بني قناتني اجلزيرة واحلرة 7 framing analysis حوليات آداب عني مشس - اجمللد )ابريل يونيو ( فاطمة الزهراء Framing analysis for policies
الشهادات عدد RAK Chamber of Commerce & Industry Studies & Information Directorate غرفة تجارة وصناعة رأس الخيمة إدارة الذراسات والمعلومات / 5 مليار دره
 الشهادات عدد / 5 مليار درهم قيمت صادراث أعضاء غرفت رأس الخيمت في 0202 حجارة ظزا إنى ان انذي حش ذ إيارة رأص انخ ت ف ج ع يجاالح ا فمذ حممج انخجارة انخارج ت أ ضا ا يهح ظا بارسا انذي ش م انخصذ ز إعادة انخصذ
مسابقة هواواي لطالب الجامعات والكليات في مجال الهندسة وتقنية المعلومات لعام 2017 Huawei ICT Skill competition Middle East 2017
 مسابقة هواواي لطالب الجامعات والكليات في مجال الهندسة وتقنية المعلومات لعام 2017 Huawei ICT Skill competition Middle East 2017 الفهرس : Contents: 1. المقدمة 1. Introduction 2. الجدول و طريقة التسجيل 2.
المؤشرات القطاعية الربعية دبي Quarterly Sectoral Indicators Dubai الربع الثالث 2018 إدارة المعلومات االقتصادية
 المؤشرات القطاعية الربعية دبي Quarterly Sectoral Indicators Dubai الربع الثالث 218 إدارة المعلومات االقتصادية الربع الثالث 218 إدارة المعلومات االقتصادية أوال : مؤشر التشيد والبناء الوصف 218 ثانيا : مؤشر
ذذذذذذذذذ أهم المؤشرات االساسية لالقتصاد االردني MAJOR ECONOMIC INDICATORS OF JORDAN ادارة السياسات والدراسات االقتصادية Economic
 ذذذذذذذذذ أهم المؤشرات االساسية لالقتصاد االردني MAJOR ECONOMIC INDICATORS OF JORDAN 10281024 ادارة السياسات والدراسات االقتصادية Economic Studies & Observation Unit تشرين الثاني 1028 November أهم المؤشرات
افتتاحية العدد
 اخلصائص الفنية لكتاب الرسائل يف القرن العشرين 412 حوليات آداب عني مشس - اجمللد 34 )يوليو سبتمرب )5102 Technical Characteristics of Letter Writers in the Twentieth Century Mohame d Gouda Abstract This research
Le ‘’French Grant’’ en faveur du secteur privé palestinien
 A well known procedure: 32 projects financed between 1993 & 2000 Well known financing tool, with numerous symbolic projects A new agreement signed on April 8th 2010 for 5 M. and extended on December 13th
جملة ميالف للبحوث والدراسات ISSN : اجمللد 4 العدد / 1 الشهر والسنة Mila Univ center. Publish. Co.. The impact of electronic management to bu
 جملة ميالف للبحوث والدراسات ISSN : 3223-1235 اجمللد 4 العدد / 1 الشهر والسنة Mila Univ center. Publish. Co.. The impact of electronic management to build structural capital of banks in Algeria - A case
Depression
 Depression patienteducation@aub.edu.lb Copyright 2014 American University of Beirut. All rights reserved. What is depression? Depression is a mood disorder. We all experience sadness from time to time,
PowerPoint Presentation
 API/iAPI Transmitting Challenges صعوبات وتحديات تطبيق برنامج تبادل المعلومات المسبقة للمسافرين Ali Al-athbi Qatar Civil Aviation Authority علي طالب العذبي الهيئة العامة للطيران قطر دولة المدني/ ICAO TRIP:
Qanoon player Furat Qaddouri and his group present Baghdady Maqams Baghdadi Maqam s project; introducing a new perspective of Iraqi maqam. The Iraqi M
 Qanoon player Furat Qaddouri and his group present Baghdady Maqams Baghdadi Maqam s project; introducing a new perspective of Iraqi maqam. The Iraqi Maqam is considered to be one of the most important
VATP004 VAT Public Clarification Use of Exchange Rates for VAT purposes توضيح عام بشأن ضريبة القيمة المضافة استخدام أسعار الصرف لغايات ضريبة القيمة ال
 VATP004 VAT Public Clarification Use of Exchange Rates for VAT purposes توضيح عام بشأن ضريبة القيمة المضافة استخدام أسعار الصرف لغايات ضريبة القيمة المضافة Issue Article 69 of Federal Decree-Law No. (8)
Determinants
 قسم الهندسة الزراعية د/ خالد ف ارن طاهر الباجورى استاذ الهندسة الز ارعية المساعد khaledelbagoury@yahoo.com Mobil: 01222430907 المقدمة ماهي المصفوفة جمع الضرب الكمي للمصفوفات ضرب منقول المصفوفة محدد المصفوفة
 (141) Ziyara [119] of lady Fatima al-ma ssooma (s) Peace be upon Adam, the choice of peace be upon Noah, the prophet of peace be upon Ibraheem (Abraham), the friend of peace be upon Musa (Moses), the speaker
اللغة العربية Items الدروس المطلوبة المتحان الفصل الدراسى األول 2019/2018 Primary 2 القراءة المحفوظات : كل الدروس : االناشيد + اآليات واالحاديث األسال
 اللغة العربية Items الدروس المطلوبة المتحان الفصل الدراسى األول 2019/2018 Primary 2 القراءة المحفوظات : كل الدروس : االناشيد + اآليات واالحاديث األساليب: كل االساليب االمالء: من الدروس المذاكرة من الكتاب
Al-Furat Model Schools Dear parents, Once again, fun moments are in the sky. Its our pleasure to inform you about Alfurat school our awesome activity
 Al-Furat Model Schools Dear parents, Once again, fun moments are in the sky. Its our pleasure to inform you about Alfurat school our awesome activity day next Thursday, which is going to be about Practicing
جامعة عني مشس حوليات آداب عني مشس اجمللد ( 45 عدد يوليو سبتمرب 2017( )دورية علمية حملمة( حماوالت التحالف الصفوي األورب
دورية علمية حملمة( حماوالت التحالف الصفوي األورب") جامعة عني مشس حوليات آداب عني مشس اجمللد 45 عدد يوليو سبتمرب 2017 http://www.aafu.journals.ekb.eg )دورية علمية حملمة ضد الدولة العثمانية 8051 8055 سم رة عبد الرزاق عبد هللا * كلية اآلداب املستخلص مجيع
جامعة عني مشس حوليات آداب عني مشس اجمللد 45 عدد يوليو سبتمرب 2017 http://www.aafu.journals.ekb.eg )دورية علمية حملمة ضد الدولة العثمانية 8051 8055 سم رة عبد الرزاق عبد هللا * كلية اآلداب املستخلص مجيع
A Comparative Evaluation of the Environmental Impact of Prefabrication versus Conventional Construction in UAE’s Construction Industry
 Subjective Evaluation of UAE inhabitant s perceptions of their Residential & Commercial Indoor Environments. تقييم خاص الداخلية بالبيئة يتعلق فيما دبي في السكان وآراء لرؤى السكنية للمباني والتجارية By:
جامعة الزرقاء المتطلب السابق : مبادئ تسو ق الكل ة :االقتصاد والعلوم االدار ة. اسم المدرس :د.عبد الفتاح العزام القسم : التسو ق موعد المحاضرة : 1-12 عنو
 جامعة الزرقاء المتطلب السابق : مبادئ تسو ق الكل ة :االقتصاد والعلوم االدار ة. اسم المدرس :د.عبد الفتاح العزام القسم : التسو ق موعد المحاضرة : 1-12 عنوان المقرر:التسو ق االلكترون الساعات المكتب ة :12-11
المعرض الزراعي السعودي تجهيز و تنظيم المعارض و المؤتمرات برنامج المعارض EVENTS CALENDAR معرض الكهرباء و التكييف السعودي المعرض السعودي للبالستيك و الم
 المعرض الزراعي السعودي تجهيز و تنظيم المعارض و المؤتمرات برنامج المعارض EVENTS CALENDAR معرض الكهرباء و التكييف السعودي المعرض السعودي للبالستيك و المعرض السعودي للطباعة معرض الرياض للسيارات ومستلزماتها
Everything you need to know about Preventive Filling For more information or an Appointment Please call Ext. New Mowa
 Everything you need to know about Preventive Filling For more information or an Appointment Please call 1826666 Ext. 2535 @NewMowasatHospital @NMOWASAT (965) 1 82 6666 www.newmowasat.com What is preventive
UNITED NATIONS PUBLICATION - e_escwa_sd_11_5_ea_0.pdf
 ECONOMIC AND SOCIAL COMMISSION FOR WESTERN ASIA (ESCWA) اللجنة االقتصادية واالجتماعية لغربي آسيا (اإلسكوا) دراسات الحسابات القومية لمنطقة اللجنة االقتصادية واالجتماعية لغربي آسيا NATIONAL ACCOUNTS STUDIES
ماجستيرالعلوم في الرياضيات يحتوي على ثالث مسارات تخصصية : الرياضيات البحتة الرياضيات التطبيقية اإلحصاء الكلية : كلية العلوم بالدمام. احلرم اجلامعي : ا
 ماجستيرالعلوم في الرياضيات يحتوي على ثالث مسارات تخصصية : الرياضيات البحتة الرياضيات التطبيقية اإلحصاء الكلية : كلية العلوم بالدمام. احلرم اجلامعي : الدمام القسم : قسم الرياضيات املسار : العلمي و اإلداري
Study Plan - Early Childhood الخطة الدراسية - طفولة مبكرة 2016 خطة البرنامج األكاديمي بكالوريوس التربية في التعليم االبتدائي تخصص: الطفولة المبك
 خطة البرنامج األكاديمي بكالوريوس التربية في التعليم االبتدائي تخصص: الطفولة المبكرة ACADEMIC PROGRAM CURRICULUM TRUCTURE ORM Degree: Bachelor of Education in Primary Education With Concentrations In Early
Everything you need to know about Plain adhesive fillings For more information or an Appointment Please call Ext. New
 Everything you need to know about Plain adhesive fillings For more information or an Appointment Please call 1826666 Ext. 2535 @NewMowasatHospital New Mowasat Hospital @NMOWASAT (965) 1 82 6666 New Mowasat
أهن الوؤشراث االساسيت لالقتصاد االرد ي MAJOR ECONOMIC INDICATORS OF JORDAN ادارة الذراساث والتذريب Research and Training Departmen
 أهن الوؤشراث االساسيت لالقتصاد االرد ي MAJOR ECONOMIC INDICATORS OF JORDAN 1025 1023 ادارة الذراساث والتذريب Research and Training Department كا ىى األول 1022 December أهن الوؤشراث االقتصاديت Major Economic
PowerPoint Presentation
 Lecture : 19 Daylighting Daylighting became a minor architectural issue because of the availability of efficient electric light sources; cheap, abundant electricity. This resulted in architects designing
Subject
 KG 1 Weekly I Plan -28 26th -30th April. 2015 Important Dates this week : Wednesday : Movie Day Every Thursday : Parent Meet and Greet 12:40-1:10 pm LA Letter: v,y Number: 20, 21 Core vocabulary: van,
BMS
 تموز (7) 28/07/ 04/07/ 11/07/ 27/07/ 06/07/ 06/07/ تصمیم أنظمة إطفاء الحریق Fire Fighting Systems Design 120 16/09/ 10/07/ CCNA (Cisco Certified Network Associate) 27 03/08/ 13/07/ تصمیم الا بنیة العالیة
Trans-Thoracic Echocardiography
 Trans-Thoracic Echocardiography patienteducation@aub.edu.lb Copyright 2016 American University of Beirut. All rights reserved. What is Trans-Thoracic Echocardiography? Trans-thoracic echocardiography (TTE),
Banner – Hold Information SOAHOLD
 1 Financial Aid System Documentation - eservice E-serviceخطوات التقديم لنظام المساعدات عبر ال 2 خطوات التقديم لنظام المساعدات Steps to apply for financial aid 1 Login to the portal http://my.uaeu.ac.ae
070.Al-Ma'arij.v1.0
 Quran Pages These Quran Pages were produced as a teaching aid for a Quran Hifz class. New Surahs are continually being produced and corrections made to existing Surahs. For the latest version of these
Feb Vol2 Issue5Arabic-English 15-5.pub
 Parents Monthly Newsleer A L - S A D D C A M P U S V O L U M E 2, I S S U E 5 A Y 2 0 1 7 / 2 0 1 8 F E B 2 0 1 8 SPECIAL P O I N T S OF INTER- EST: Mission Our mission is to provide students with an equitable
Everything you need to know about Abscess For more information or an Appointment Please call Ext. New Mowasat Hospita
 Everything you need to know about Abscess For more information or an Appointment Please call 1826666 Ext. 2446 @NewMowasatHospital @NMOWASAT (965) 1 82 6666 www.newmowasat.com An abscess is a collection
TABLE OF CONTENT Welcome to Villanova A New Address for your Family Location Benefits Location Map Villanova Master Plan La Rosa Master Plan La Rosa F
 TABLE OF CONTENT Welcome to Villanova A New Address for your Family Location Benefits Location Map Villanova Master Plan La Rosa Master Plan La Rosa Floor Plan Project No. 2156 WELCOME TO VILLANOVA A
THE LIVING ADVENTURE المغامرة الحية 02 03
 THE LIVING ADVENTURE المغامرة الحية 02 03 OVERVIEW LOCATION UNIT PLAN 08 10 27 نظرة عامة الموقع مخطط الوحدات 04 05 IMAGINE LIVING IN A WORLD FULL OF ADVENTURE تخيل الحياة في عالم حافل بروح المغامرة 07
Grade 2 Unit P.2 Electricity 1
 1 المعايير المغطاة في هذه الوحدة Standards for the unit 2.9.1 Name and use some common devices that use electricity. 2.9.2 Know that common electrical devices can make light, sound, heat and movement.
Smoking Cessation Program
 Smoking Cessation Program Copyright 2018 American University of Beirut. All rights reserved. Need help to quit smoking? We are here for you. The Smoking Cessation Program at the Health and Wellness Center
قاي مة أسعار المجم ع الرياضي Sports Complex Price List
 قاي مة أسعار المجم ع الرياضي Sports Complex Price List انطلقي إلى عالم من الرياضة تحت سقف واحد. استمتعي باالستجمام على شاطئ النادي وبمزاولة رياضة السباحة والتنس والتزلج على الجليد في المرافق المجهزة بأحدث
كل ة الترب ة األساس ة مكتب الترب ة العمل ة بطاقة تقو م الطالب المعلم تخصص اللغة االجنلل ي ة 02 / 02 المجنطقة التعل م ة:... العام الدراس : م... : المرح
 كل ة الترب ة األساس ة كتب الترب ة العل ة بطاقة تقو الطالب العل تخصص اللغة االجنلل ي ة 2 / 2 الجنطقة التعل ة:... العا الدراس :... : الرحلة التعل ة:... الفصل الدراس... :... اس الدرسة : اس الطالب...... الشرف
االستخدام اآلمن للكهرباء Safe use of electricity نـعمل مـن أجل ســالمتكم Conscious for your safety
 االستخدام اآلمن للكهرباء Safe use of electricity نـعمل مـن أجل ســالمتكم Conscious for your safety The ideal use of electricity in our life will lead us to avoid the potential risks and occurrences of
Labour Statistics Bulletin LabourinStatistics GCC Countries in GCC2016 Countries
 Labour Statistics Bulletin LabourinStatistics Countries in Countries 1 Contents المحتويات Lis of Tables 5 List of Figures 7 Introduction 13 Symbols Used in Tables 17 4 6 12 14 قائمة الجداول قائمة األشكال
Abstract : This study deals with leasing as one of the more appropriate entreprise s financing means. Despite the availability of many fina
 4 4 Abstract : This study deals with leasing as one of the more appropriate entreprise s financing means Despite the availability of many financing sources, it is imperative to take into account the modern
Project Scheduling, Planning, Costing & Budgeting (ECCM Workshop 2) Certified Program البرنامج الزمني والمالي للمشروع التكلفة والتقدير واعداد الميزاني
 Certified Program البرنامج الزمني والمالي للمشروع التكلفة والتقدير واعداد الميزاني") البرنامج الزمني والمالي للمشروع التكلفة والتقدير واعداد الميزانية معتمد عالميا 22 26 July 2019 Paris / France Introduction This 5-day workshop provides the construction professional with a detailed understanding
البرنامج الزمني والمالي للمشروع التكلفة والتقدير واعداد الميزانية معتمد عالميا 22 26 July 2019 Paris / France Introduction This 5-day workshop provides the construction professional with a detailed understanding
Department of Computer Information Systems
 Departmet of Computer Iformatio Systems CIS : Itroductio to Iformatio Techology Topic 5 Numberig Systems (Exteral Material) Chapter Outlie Numberig Systems Coversio Betwee Systems ملخص الفصل أنظمة الا
وث _ 2018 اململكة العربية السعودية وزارة التعليم جامعة اإلمام حممد بن سعود اإلسالمية كلية االقتصاد والعلوم اإلدارية كا ة ر سات عليا ث علمي وكال ة الدر
 وث _ 2018 اململكة العربية السعودية وزارة التعليم جامعة اإلمام حممد بن سعود اإلسالمية كلية ا والعلوم اإلدارية كا ة ر سات عليا ث علمي وكال ة الدراسات العليا والبحث العلمي فعاليات الو حدة 2018 فعا يات علمية